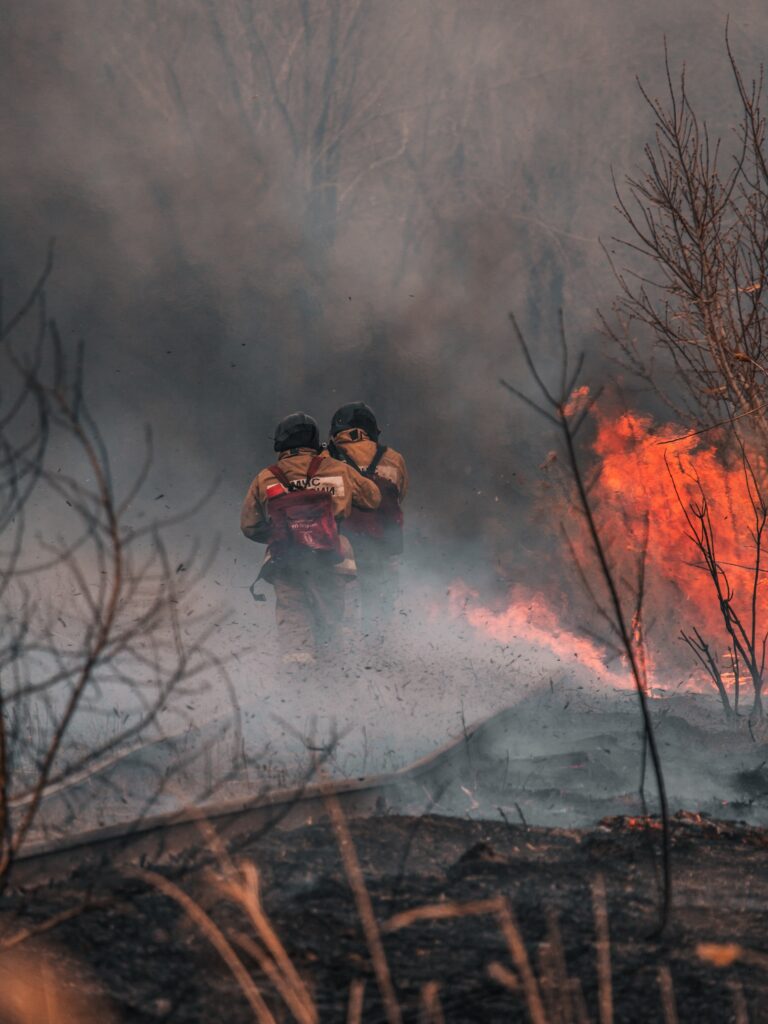
According to the WHO, since 1998, more than 2 billion people worldwide have been affected by floods – directly or indirectly. The European Environment Agency reports that between 1980 and 2017, the economic losses due to floods in the European Union alone amounted to nearly 160 billion Euro. Besides the construction and development of flood prevention infrastructure, the risk management of floods is an important tool for combating floods. The most important element for assessing and verifying flood risks are the flood hazard maps and the flood risk maps, developed as part of the project by the consortium led by the IMGW-PIB. Maps are available on the website: https://wody.isok.gov.pl/hydroportal.html.
Dr Paweł Przygrodzki, Director of the National Hydrological Protection Center at IMGW-PIB talks about the unique maps.
What was the basis for creating the maps?
Flood hazard maps (FHM) and flood risk maps (FRM) were developed on the basis of the provisions of the Floods Directive, the provisions of which were implemented into Polish legislation by the Water Law Act. In turn, the detailed requirements for the preparation of maps were described in the relevant regulation. The maps have to be updated every six years. Their image results in flood risk management plans and actions to improve the country’s level of flood protection.
Has the mapping been a very demanding project?
Yes, it is one of the largest and most important projects in the Institute in the last decade. We have been working on it for almost three years. The Institute was the project leader in a consortium with ARCADIS and MGGP, and the client was PGW Wody Polskie KZGW. The Institute, we adopted an offensive strategy and engaged our flood and drought modeling centers, hydrological forecasts and studies offices. We were also supported by other centers. Despite the pressure of time, everyone showed accuracy and professionalism.
What are flood hazard maps, and what do flood risk maps present?
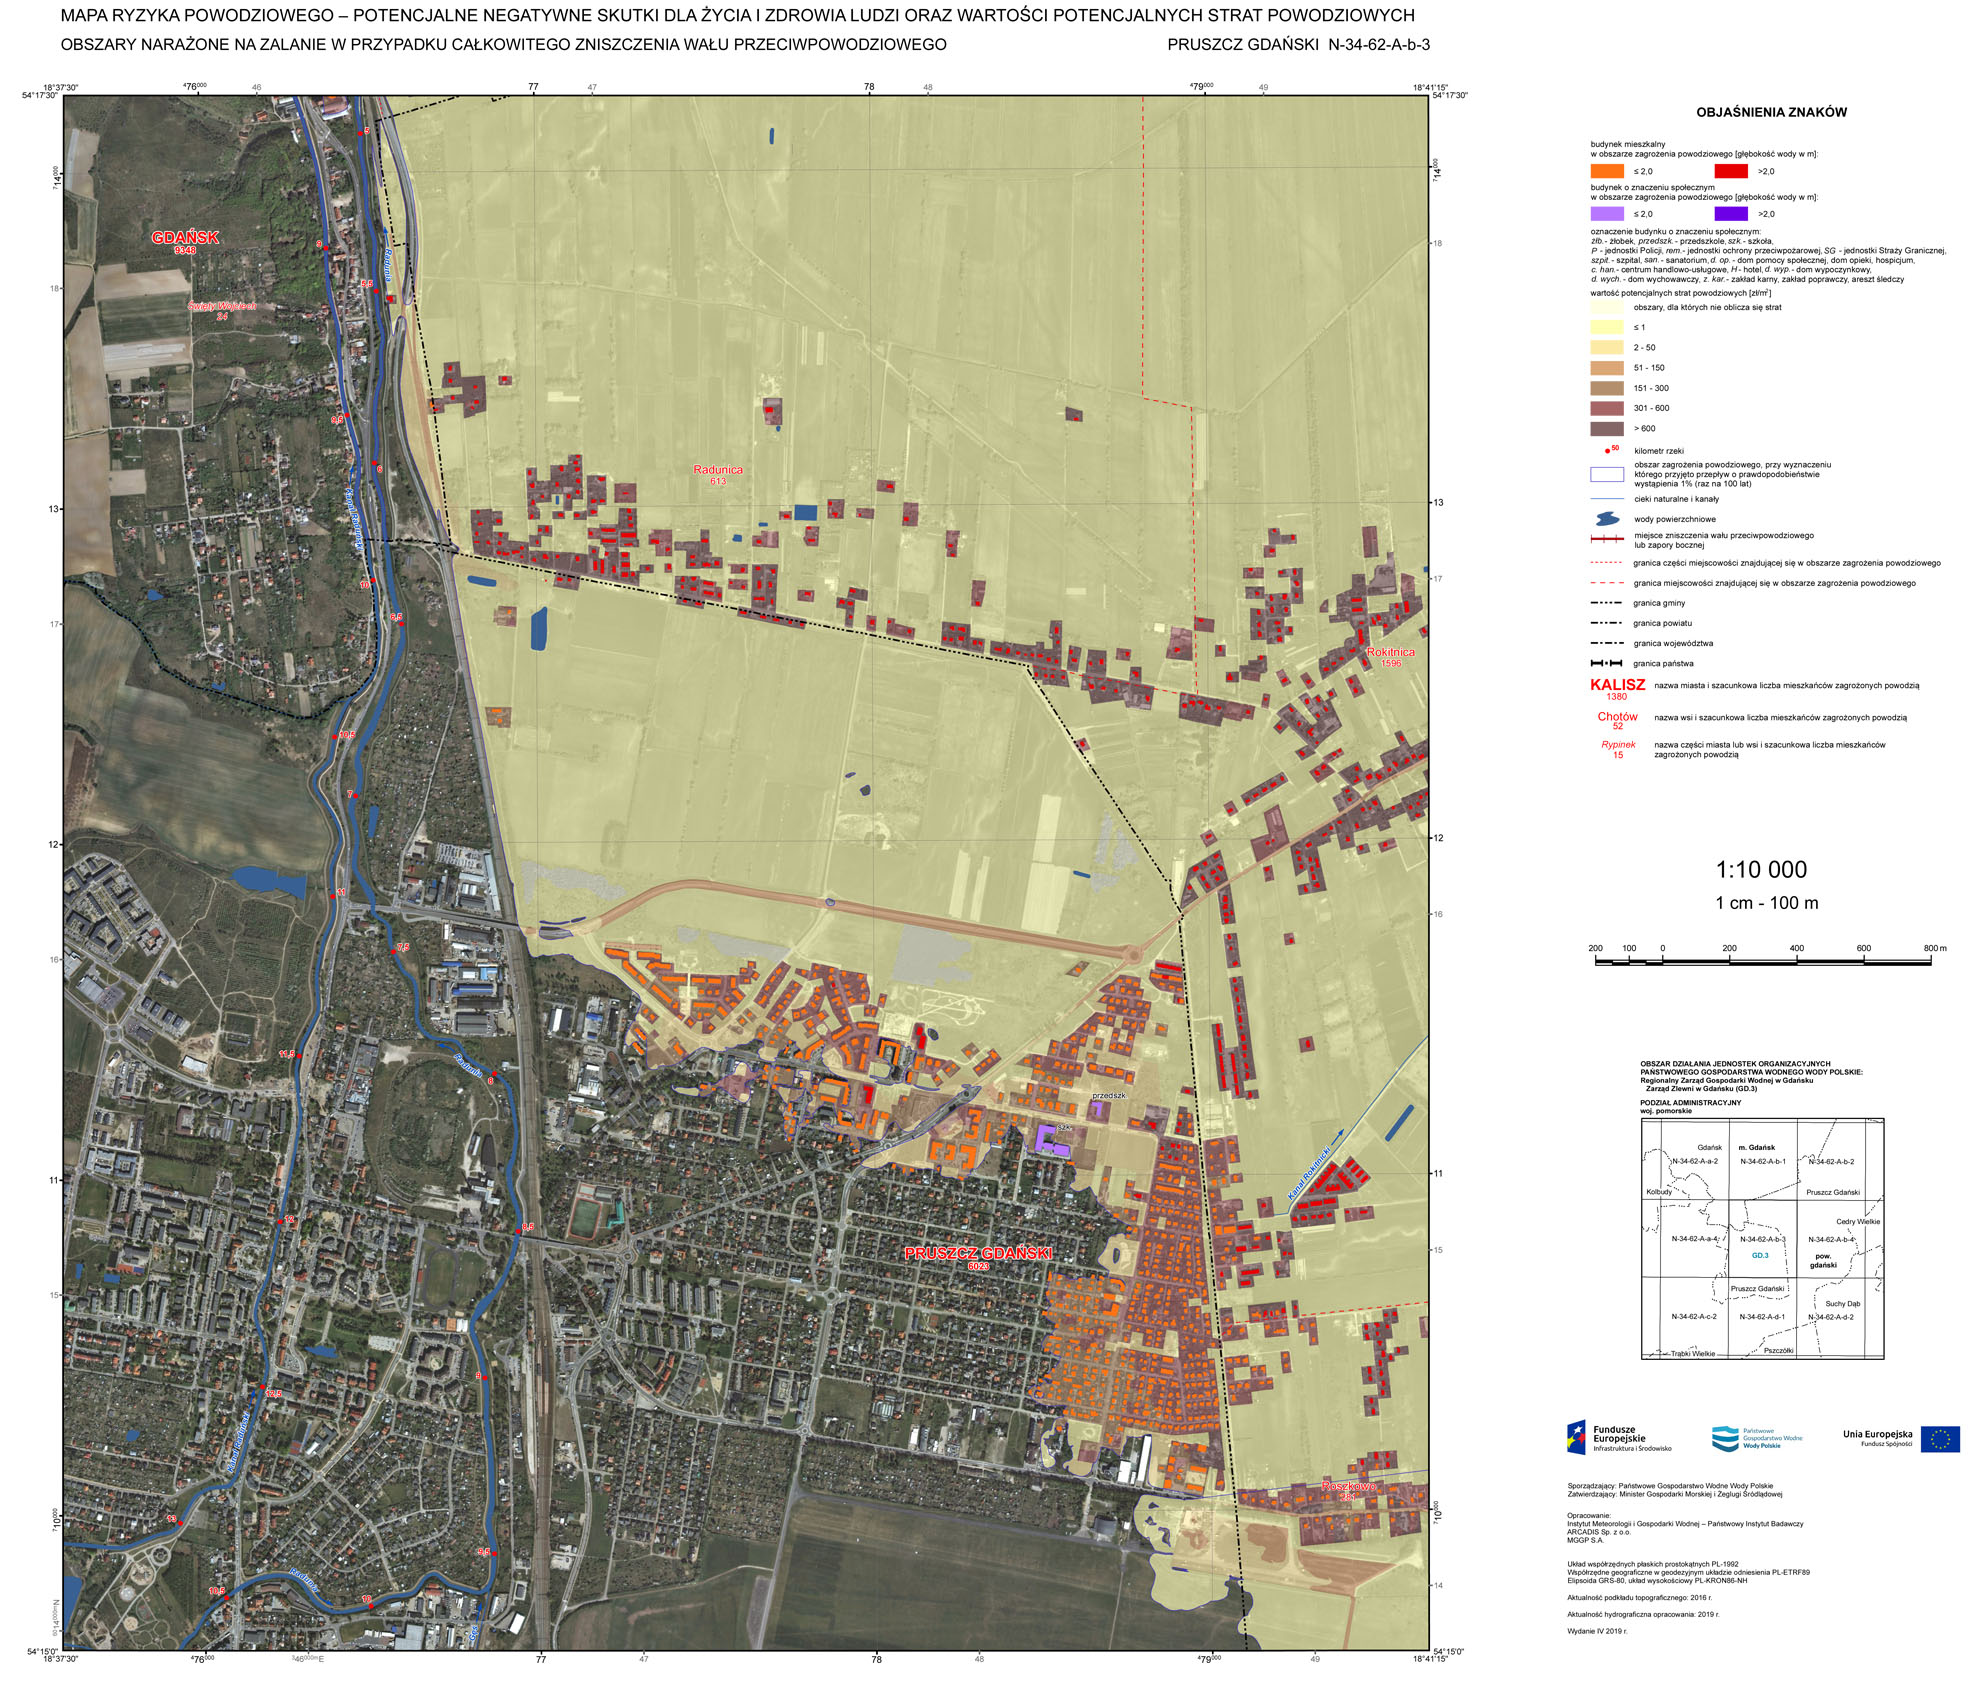
The maps are an indicator of the threat and risk of flooding in a given area. Each of us is able to analyze hazard maps, to understand where and how high water levels are expected during a flood. Flood risk maps, on the other hand, provide information on the potential flood losses and negative effects of floods.
What is the main content of the maps?
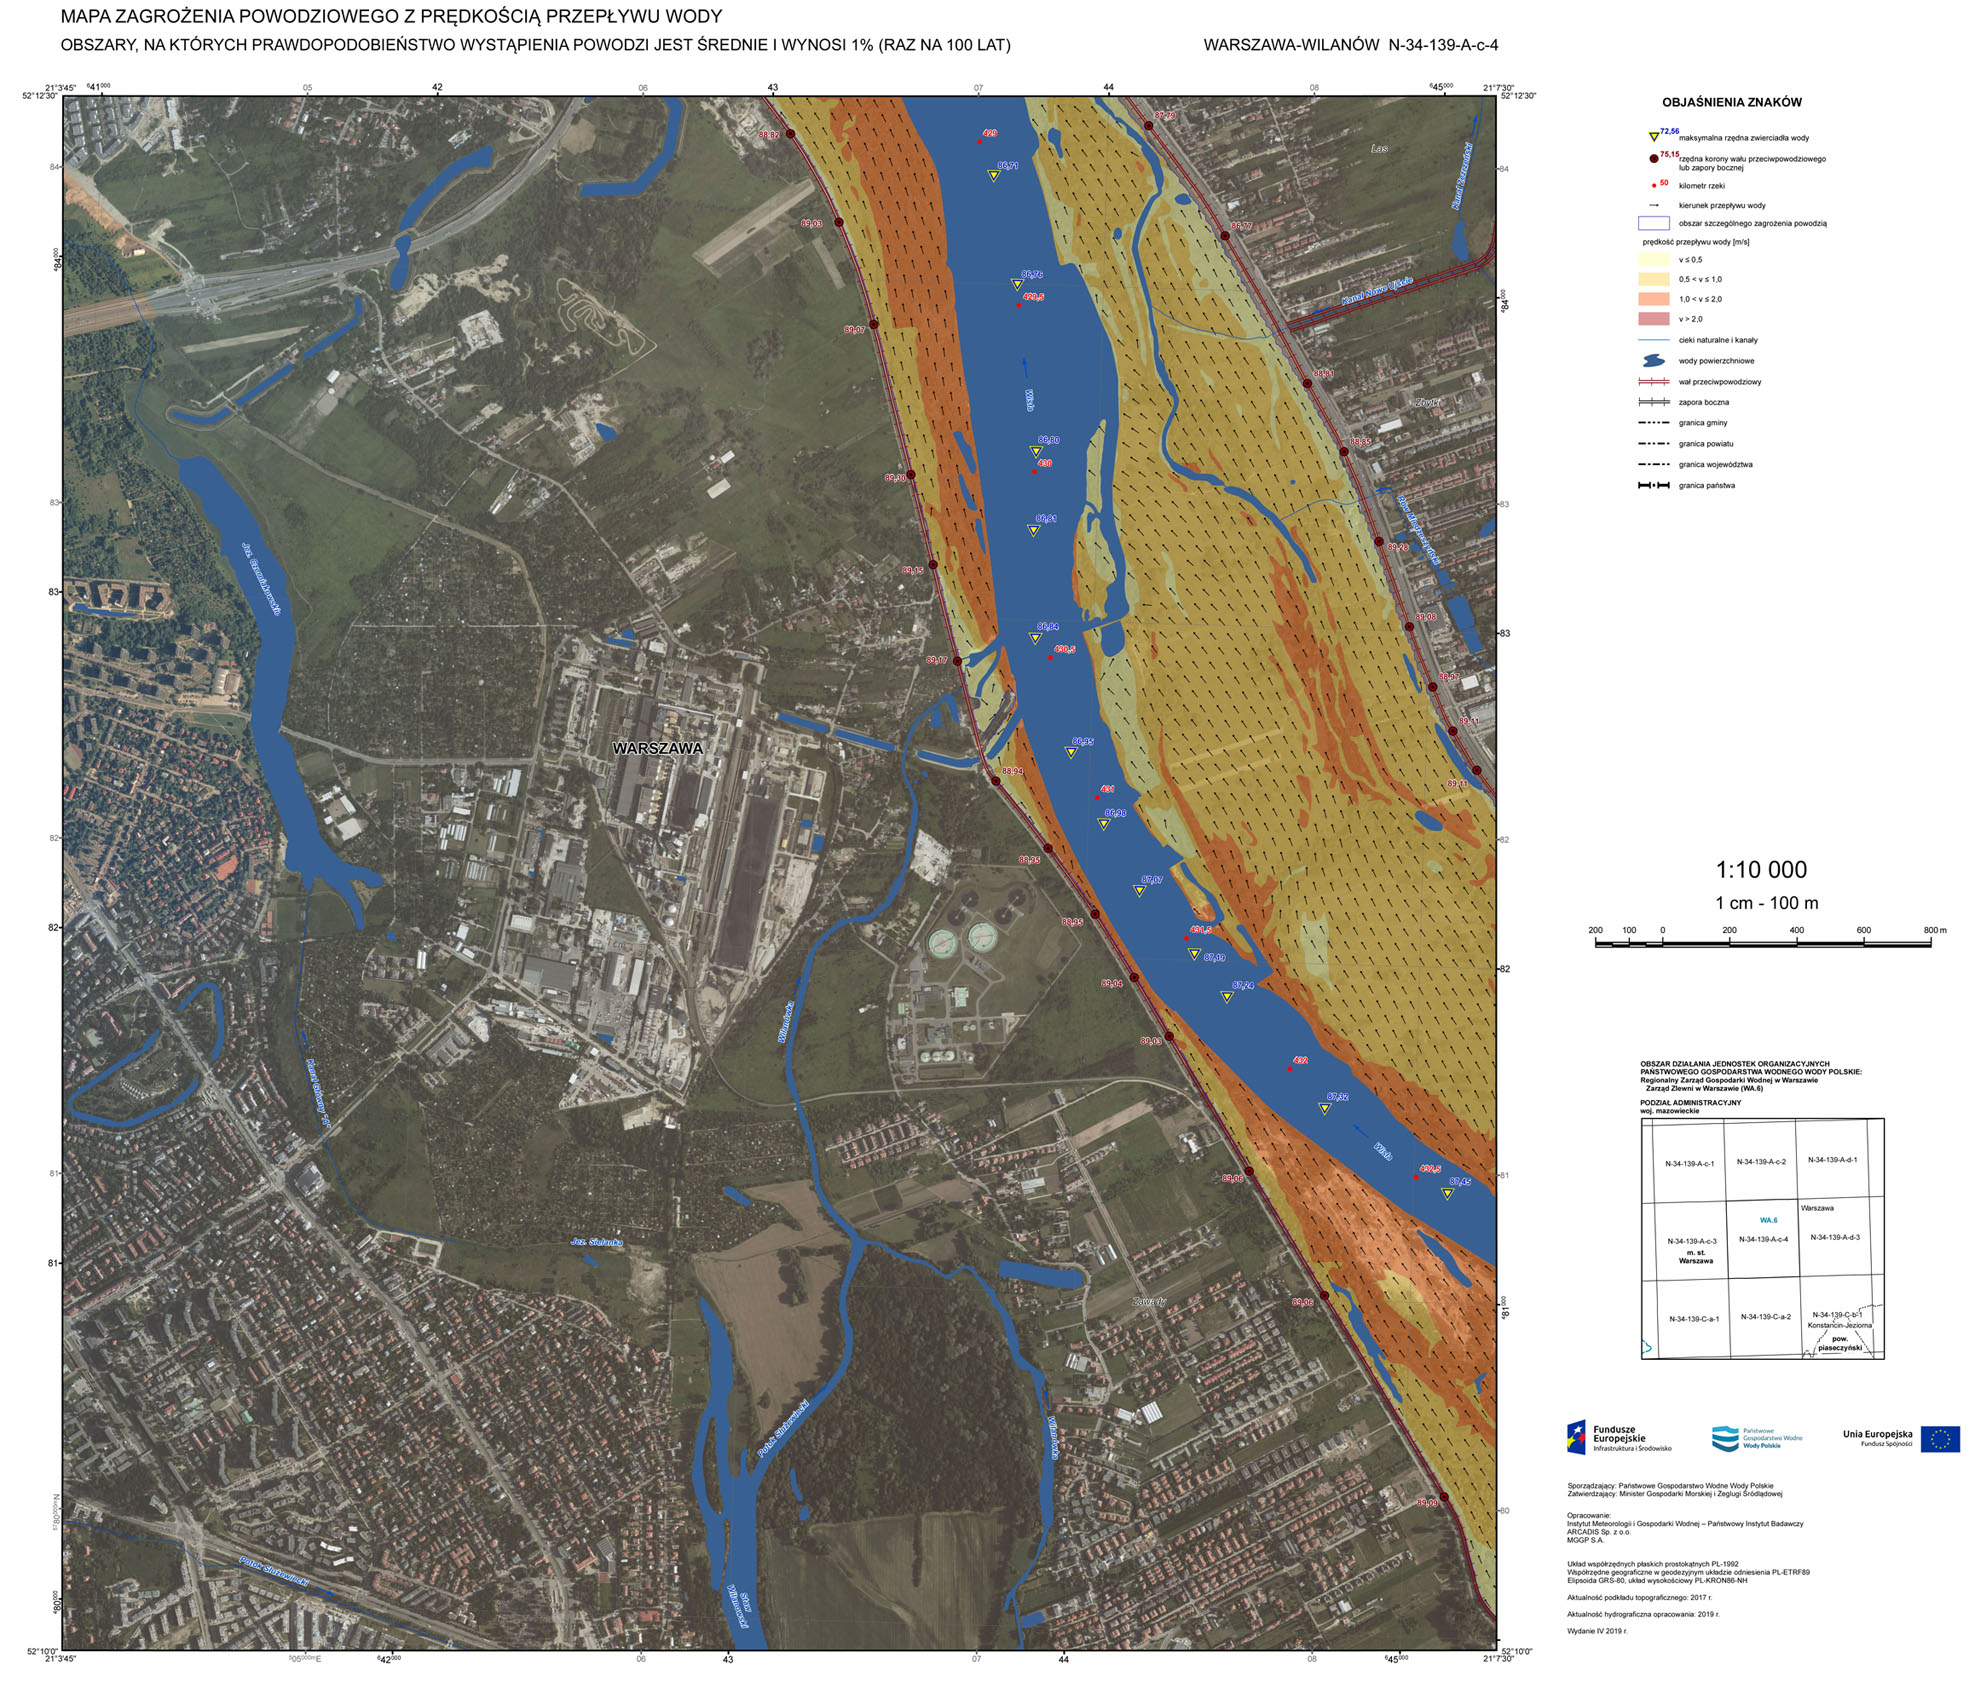
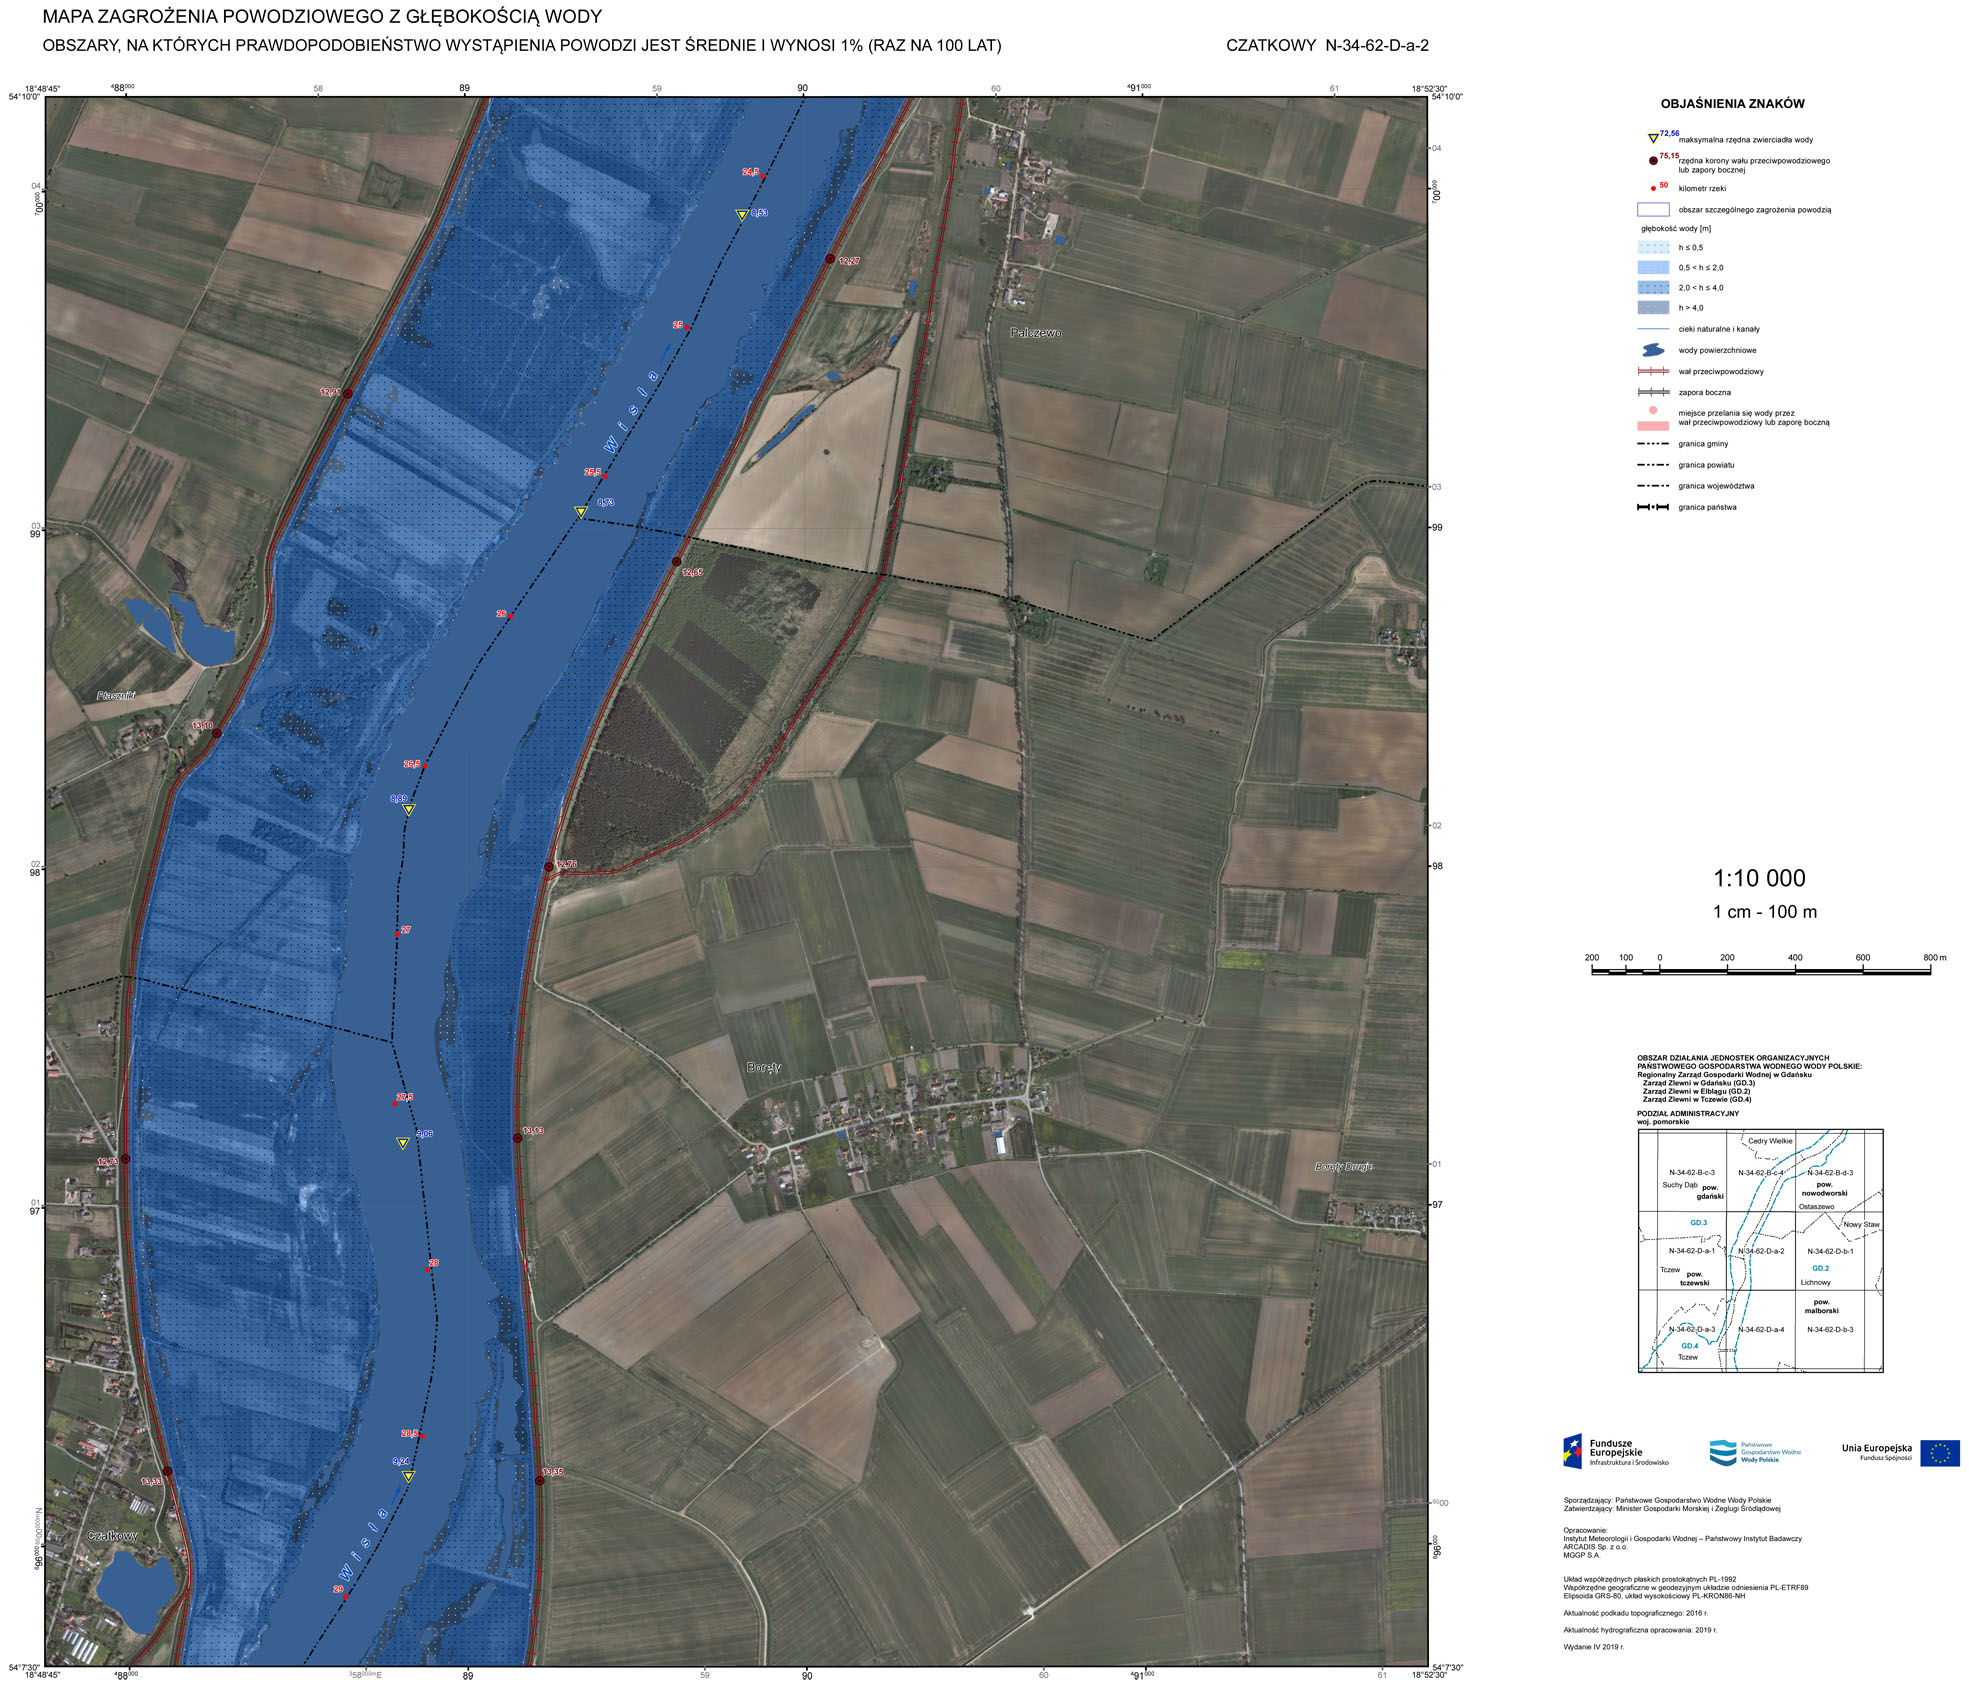
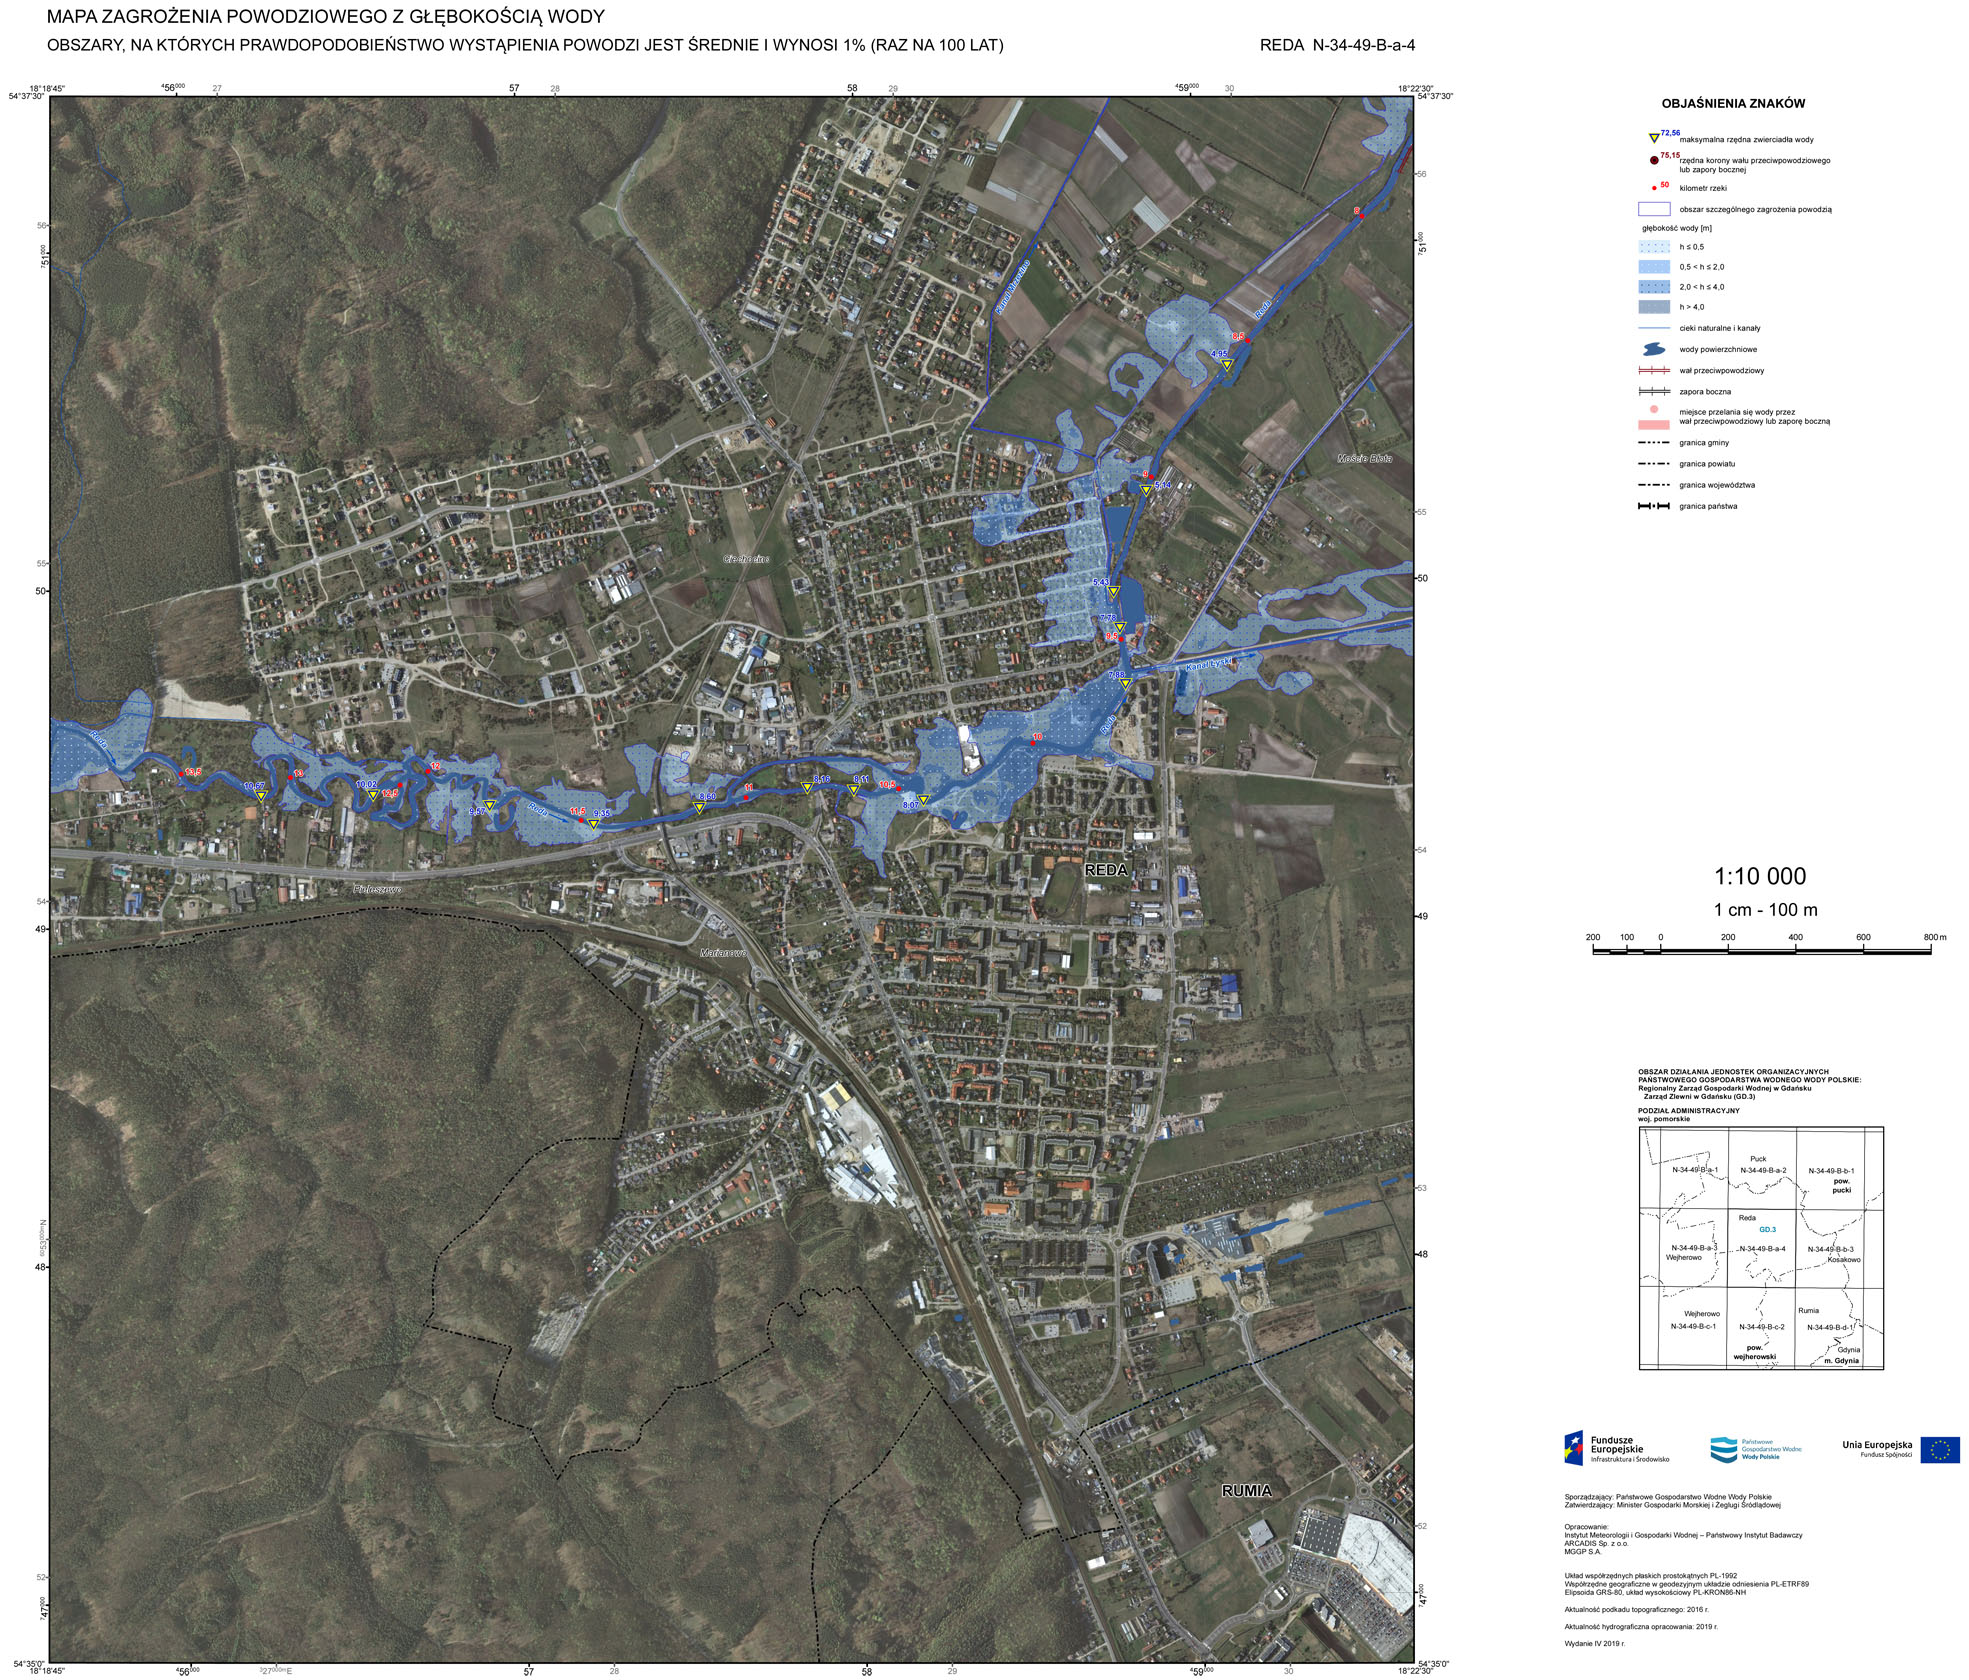
The essential information on the maps are the flood hazard areas, which are determined based on the results of mathematical hydraulic modeling, using geographic information systems (GIS), based on the numerical terrain model (NTM). For flood hazard areas, the water depth values are specified on the FHM maps, and for large cities, additionally velocities and directions of its discharge. The greater the depth and velocity of the water, the greater the threat. Moreover, for an even more accurate assessment of the flood risk, the FHM maps show the water table’s maximum ordinates during an expected flood and the embankment height. Flood Hazard Maps (FHM) visualize the potential negative effects of a flood on society, the environment, cultural heritage, and the economy.
The process of determining flood hazard areas seems complicated. The question is, how exactly did it go?
Indeed, it is a complicated process, requiring experience, scientific and practical knowledge, and time. We used mathematical hydraulic modeling to produce the maps, but earlier, we have had to develop hydrological data. They included, among others, maximum discharges with a specified exceedance probability and hypothetical waves for modeled streams. For us, this is our day-to-day knowledge. Although it might sound mysterious to our recipients, the final effects on the maps are clear and transparent. Back to the question. Hydrological data were prepared in the hydrological forecasts offices of the IMGW-PIB throughout the country. Collected data were implemented into hydraulic models that were calibrated and verified in advance and were based on historical floods. The next step was modeling flood scenarios. The modeling results were then processed in a GIS machining process that must be accurate and error-free. Flood hazard areas were then symbolized depending on the type and nature of maps.
You mentioned the diligence in elaborating the maps. Can you guarantee the accuracy of the results presented there?
Yes, definitely. The maps were subject to control at various stages of their development. However, it should be remembered that the excellent quality of the maps is a combination of reliable input data, the hydraulic model, and the GIS development. The teams of experts responsible for maps’ development should not be forgotten. Their involvement has helped to deal with this extremely difficult project.
I wonder whether the flood hazard areas are mapping areas where floods have already occurred in the past?
They present the areas for which floods have been statistically determined with the appropriate probability or for a specific event. Therefore, it does not mean that a flood actually occurred in the areas with designated flood hazard areas, or at least we do not have any evidence of it. However, this does not change the fact that flood hazard areas are essential information on the level of flood hazard and risk in a given area. In the project, we developed flood scenarios for the probability of flooding with 0.2% flow – once every 500 years, 1% – once every 100 years, 10% –once every 10 years, and destruction of the embankment.
The maps were created and are updated on a regular basis. I am curious about the area and the number of rivers covered by the study?
For the hazards of river floods, FHM has been developed or updated for approx. 21 thousand km of rivers, while FRM for approx. 29 thousand km of rivers. It resulted in either the development or updating of almost 60,000 map sheets! The numbers are impressive, and the amount of data processed was gigantic. The process is cyclical, as well as other tasks under the Floods Directive. These tasks’ outputs are reviewed and updated in 6-year cycles, mainly due to changes in input data.
Can maps be developed and in what direction?
Flood hazard maps should be developed towards rapid floods resulting from the accumulation of surface runoff as due to heavy rainfall. It is a need resulting from climate change. Intensive rainfalls separating more extended periods of drought increase the risk of such floods.
What were the essential qualifications necessary to implement the project?
The skills of hydraulic and hydrological modeling, working with GIS software, knowledge and experience in hydrology, as well as the ability to operate under time pressure were particularly important. Last year was unusual due to the pandemic and implementation of remote working in IMGW-PIB. All the more, I would like to thank all the specialists that they organized time in a way that enables them to complete the project to relevant standards, often reconciling it with the presence of all household members. The team that I have the pleasure to work with and lead are experts with the highest skills.
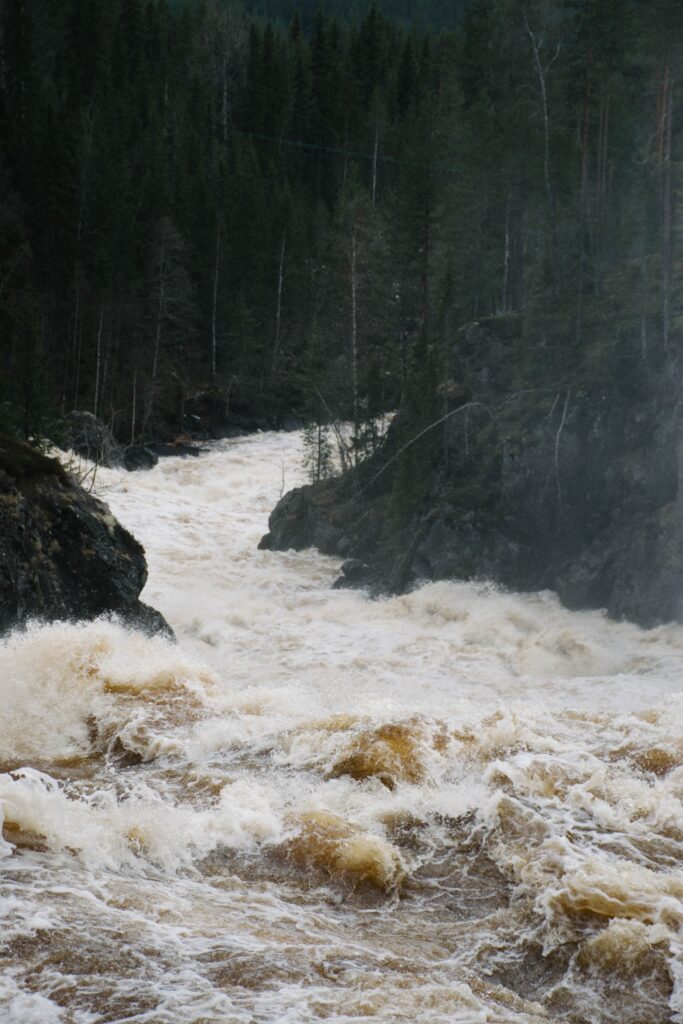
Main Photo: Andreas Eriksson | Unsplash