Storm surge floods are one of the most catastrophic natural phenomena on Earth. They cause unimaginable financial and environmental damage worldwide every year, but above all, thousands of deaths. Although the Baltic Sea appears to be much less dynamic and dangerous than the North Sea or the Atlantic Ocean, historical documents and current observations confirm the devastating potential of the Baltic Sea. In 1983, a storm on the Vistula Lagoon flooded nearly 3,000 hectares of Nowakowska Island. In 2009, wind gusts in the peak of the storm surge flood reached 95 km/h. Today, we can react better and faster to storm surge risks due to flood hazard maps based on storm surge scenarios. Their development was one of the greatest challenges for the Institute of Meteorology and Water Management-National Research Institute (IMGW-PIB) in the twenty-first century.
AUTHOR: Janusz Topiłko, IMGW-PIB/National Hydrological Protection Centre, Department of Hydrological Forecasts and Studies in Gdynia
In 2005, one of the most devastating hurricanes in history called Katrina, hit the southeast coast of the United States. With winds blowing at speeds up to 280 km/h, 8-meter waves were raised, breaking the levee system around New Orleans and flooding the city and surrounding areas. 1,464 people died. In 2016, hurricane Mathew struck Haiti. The wind speed reached almost 230 km/h, and the 16 meter-high waves and the 3-meter-high backwater surged the island’s southern coast, killing nearly 600 people. In Europe, the storm in 1953 was the most tragic. All the countries bordering the North Sea suffered huge losses. 200,000 hectares of land were flooded in the Netherlands, and almost 1,800 people lost their lives.
The Baltic Sea seems much calmer and predictable to us. However, historical documents prove how dangerous storms in the Baltic Sea can be. A violent storm in 1872 caused at least 272 deaths and left over 15,000 people homeless. On December 27-31, 1913, a storm developed, during which the most popular hotel, Kurhaus Ost-Dievenow in Dziwnów, was flooded and destroyed. The number of people who lost their lives remains unknown. During the storm, the highest sea level in history was recorded in Świnoujście (303 cm above mean sea level). The water threw numerous vessels, including the Russian schooner Austrumus into the surrounding beaches.
EU Floods Directive – changing the approach to the hazard
It is not easy to prevent storm floods. One of the ways to reduce the negative effects of this phenomenon are various types of structures and equipment, e.g., storm embankments, shore bands, along-shore breakwaters, or storm gates. A significant element of non-technical system solutions is Directive 2007/60 / EC of the European Parliament and the Council of 23 October 2007 on the assessment and management of flood risks, known as the „Flood Directive”.
This document obliges the EU Member States to develop a preliminary flood risk assessment, flood hazard maps, flood risk maps, and flood risk management plans. Thus, it has provided the basis for using hydrodynamic modeling as the primary tool for the development of flood hazard maps in most EU countries.
In Poland, three different approaches have been implemented to assess the flood hazard from marine waters since the use of the Flood Directive. Until 2010, when the methodology for calculating flood risks was developed, it was based on the assumption that the main aim was flood protection from sea waters and internal maritime waters at a level of 2.50 m above mean sea level. The change of approach came with the development of the „Methodology for calculating maximum water levels with a defined probability of exceeding for the coast and estuary sections of rivers affected by the sea, to use the results for hydrodynamic modeling, and then to develop flood hazard maps and flood risk maps”. The guidelines from this document were the basis for developing the first flood hazard maps and flood risk maps in 2010. At the same time, the need to clarify certain contentious issues was noticed during the first planning cycle. The result is a modified version of the guidelines „Methodology for developing flood hazard maps and flood risk maps from the maritime water in the second planning cycle”.
Boundary conditions in mathematical modeling
Flood hazard maps are based on the results of mathematical hydrodynamic models that require the proper preparation of boundary conditions for hazard from marine waters and internal marine waters in the form of:
- statistically and probabilistically developed maximum values of flood with a defined exceedance probability, i.e., a flood every 100 years (p = 1%) and a flood every 500 years (p = 0.2%);
- development of the shapes of hypothetical flood waves – an extremely significant issue for estimating the volume of water moving towards flood risk areas;
- taking into account mean sea level increase due to climate change;
- taking into account the wind force and direction in a function of time as the main propagation force of storm surge floods.
The correct determination of the boundary conditions is crucial for obtaining reliable calculations from mathematical hydrodynamic models and thus for determining the extents of flood hazard areas.
Modeling of flood hazard extents due to storm surges
Storm floods modeling aims to determine the water levels in coastal areas with very diverse shorelines. It is much easier to model storm surge in areas of beaches with high dunes or cliff areas than areas with polders protected by levees, and intersected estuary sectors of rivers that allow flood to move long distances inland.
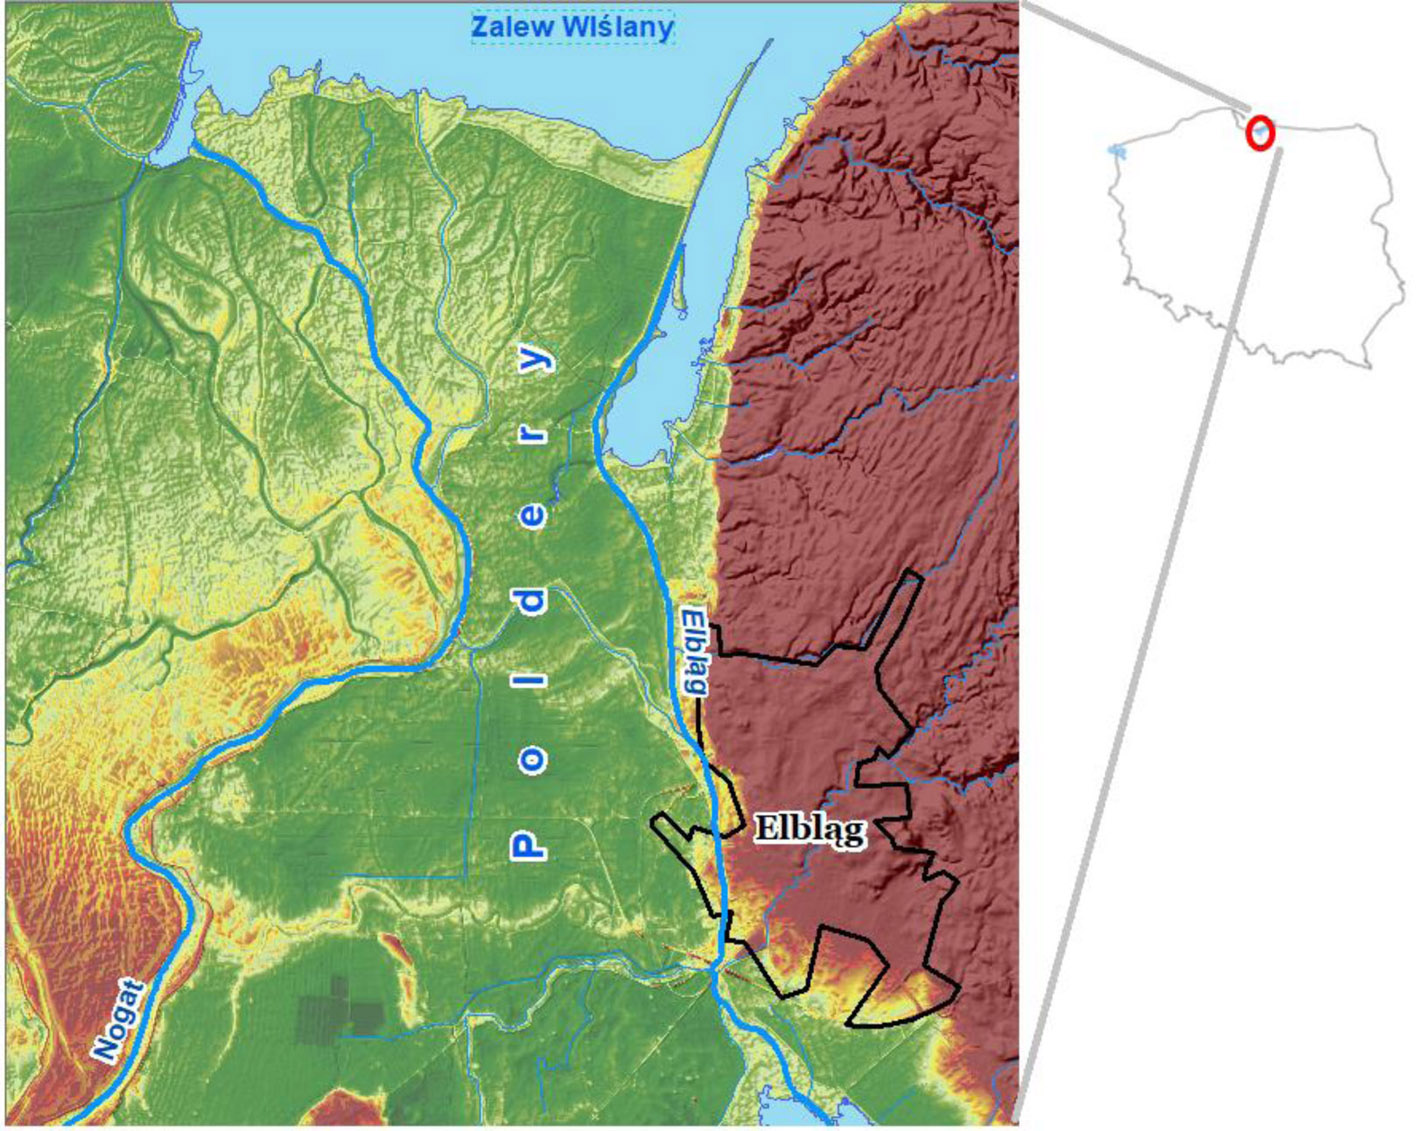
Case study – flood hazard of Żuławy Elbląskie
Characteristics of the modeling area
Żuławy Elbląskie is a part of Żuławy Wiślane – a vast delta plain of the Vistula, a significant part of which are below sea level depressive areas. The region’s eastern border is Elbląg Upland and the Elbląg River that flows from Lake Drużno to the Vistula Lagoon. There are extensive polders along the west bank of the river. The entire area is particularly vulnerable to storm floods from the lagoon.
Designation of flood hazard areas before the first cycle of flood hazard maps
As already mentioned, before 2010, the protection of seashores from the effects of floods was based on the protection of the shores up to 2.50 m above the mean sea level. Such an approach did not determine the degree of flood hazard in areas other than hydro-technical structures and storm and flood protection embankments built according to this principle. Thus, it was impossible to determine the impact of these objects on reducing the extent of storm surges into the estuary sections of rivers and canals and adjacent areas, such as polders. This, in turn, hindered the implementation of appropriate preventive and protective measures.
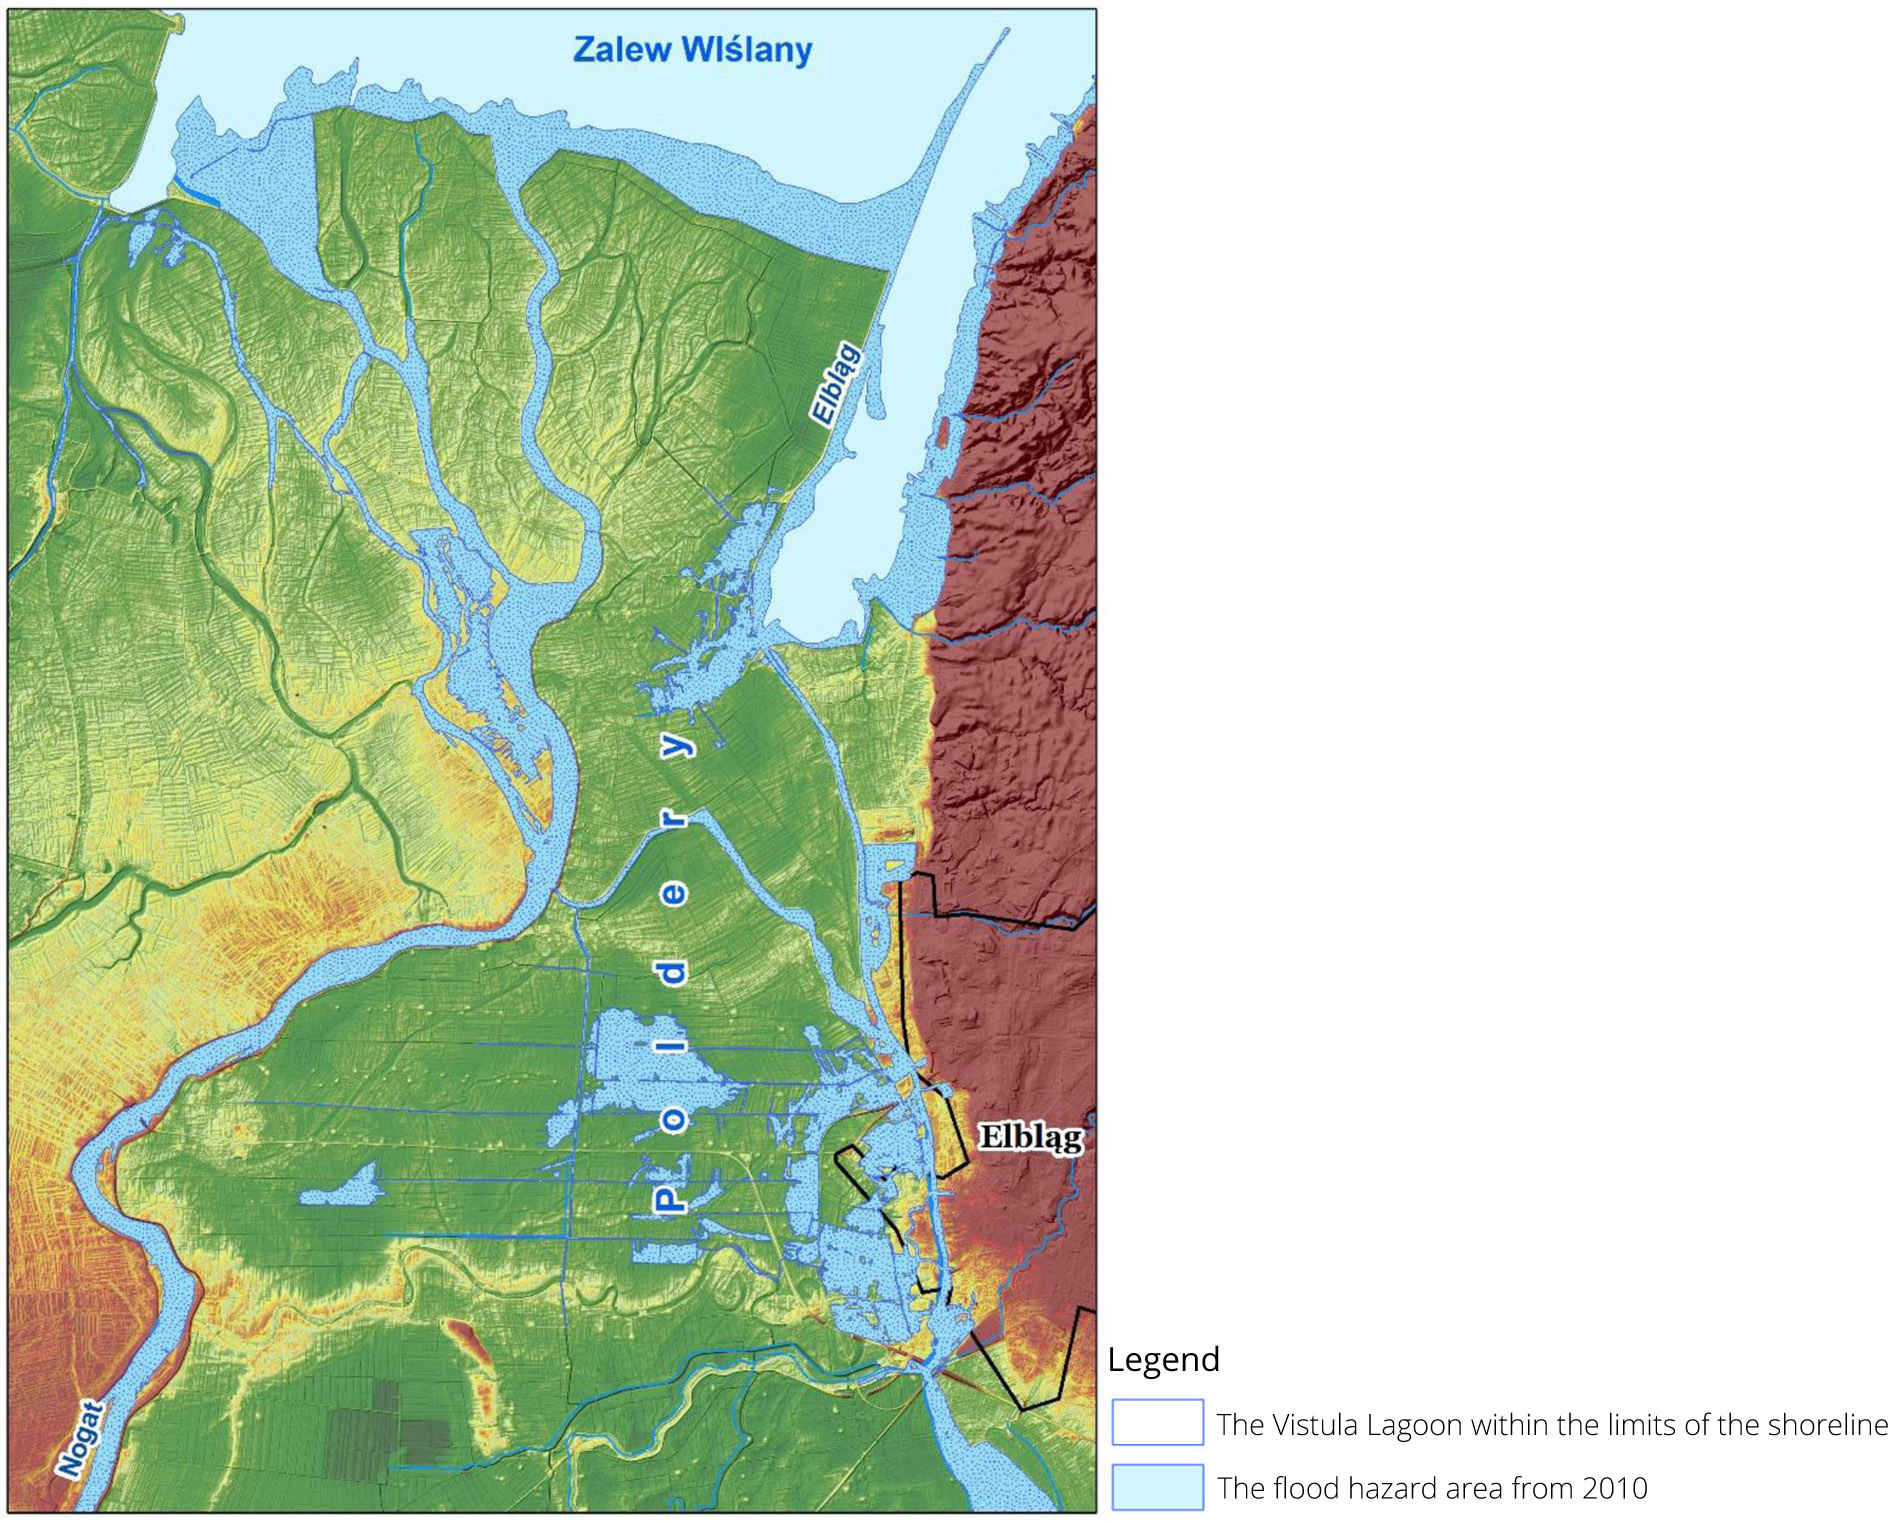
Designation of flood hazard areas in the first cycle of flood hazard maps
The first flood hazard maps were based on the „Methodology for calculating maximum water levels …” published in 2010. For a storm surge with a probability of exceeding p = 1% (once every 100 years) in the estuary section of the Elbląg River, the following boundary conditions for mathematical hydrodynamic models were adopted:
- Zp1% = 1.63 m above sea level, as the maximum level of internal sea waters (the Vistula Lagoon), determined as a result of statistically and probabilistically processed observational data;
- determination of the shape of a hypothetical wave based on six historical storm surges;
- addition of 5 cm as equivalent to the mean sea level rise due to climate change for the Vistula Lagoon (IPCC scenario: A2 Mean sea level rise until 2030);
- in addition to the mathematical calculations, a wind with a constant speed of 10 m/s perpendicular to the shoreline was introduced.
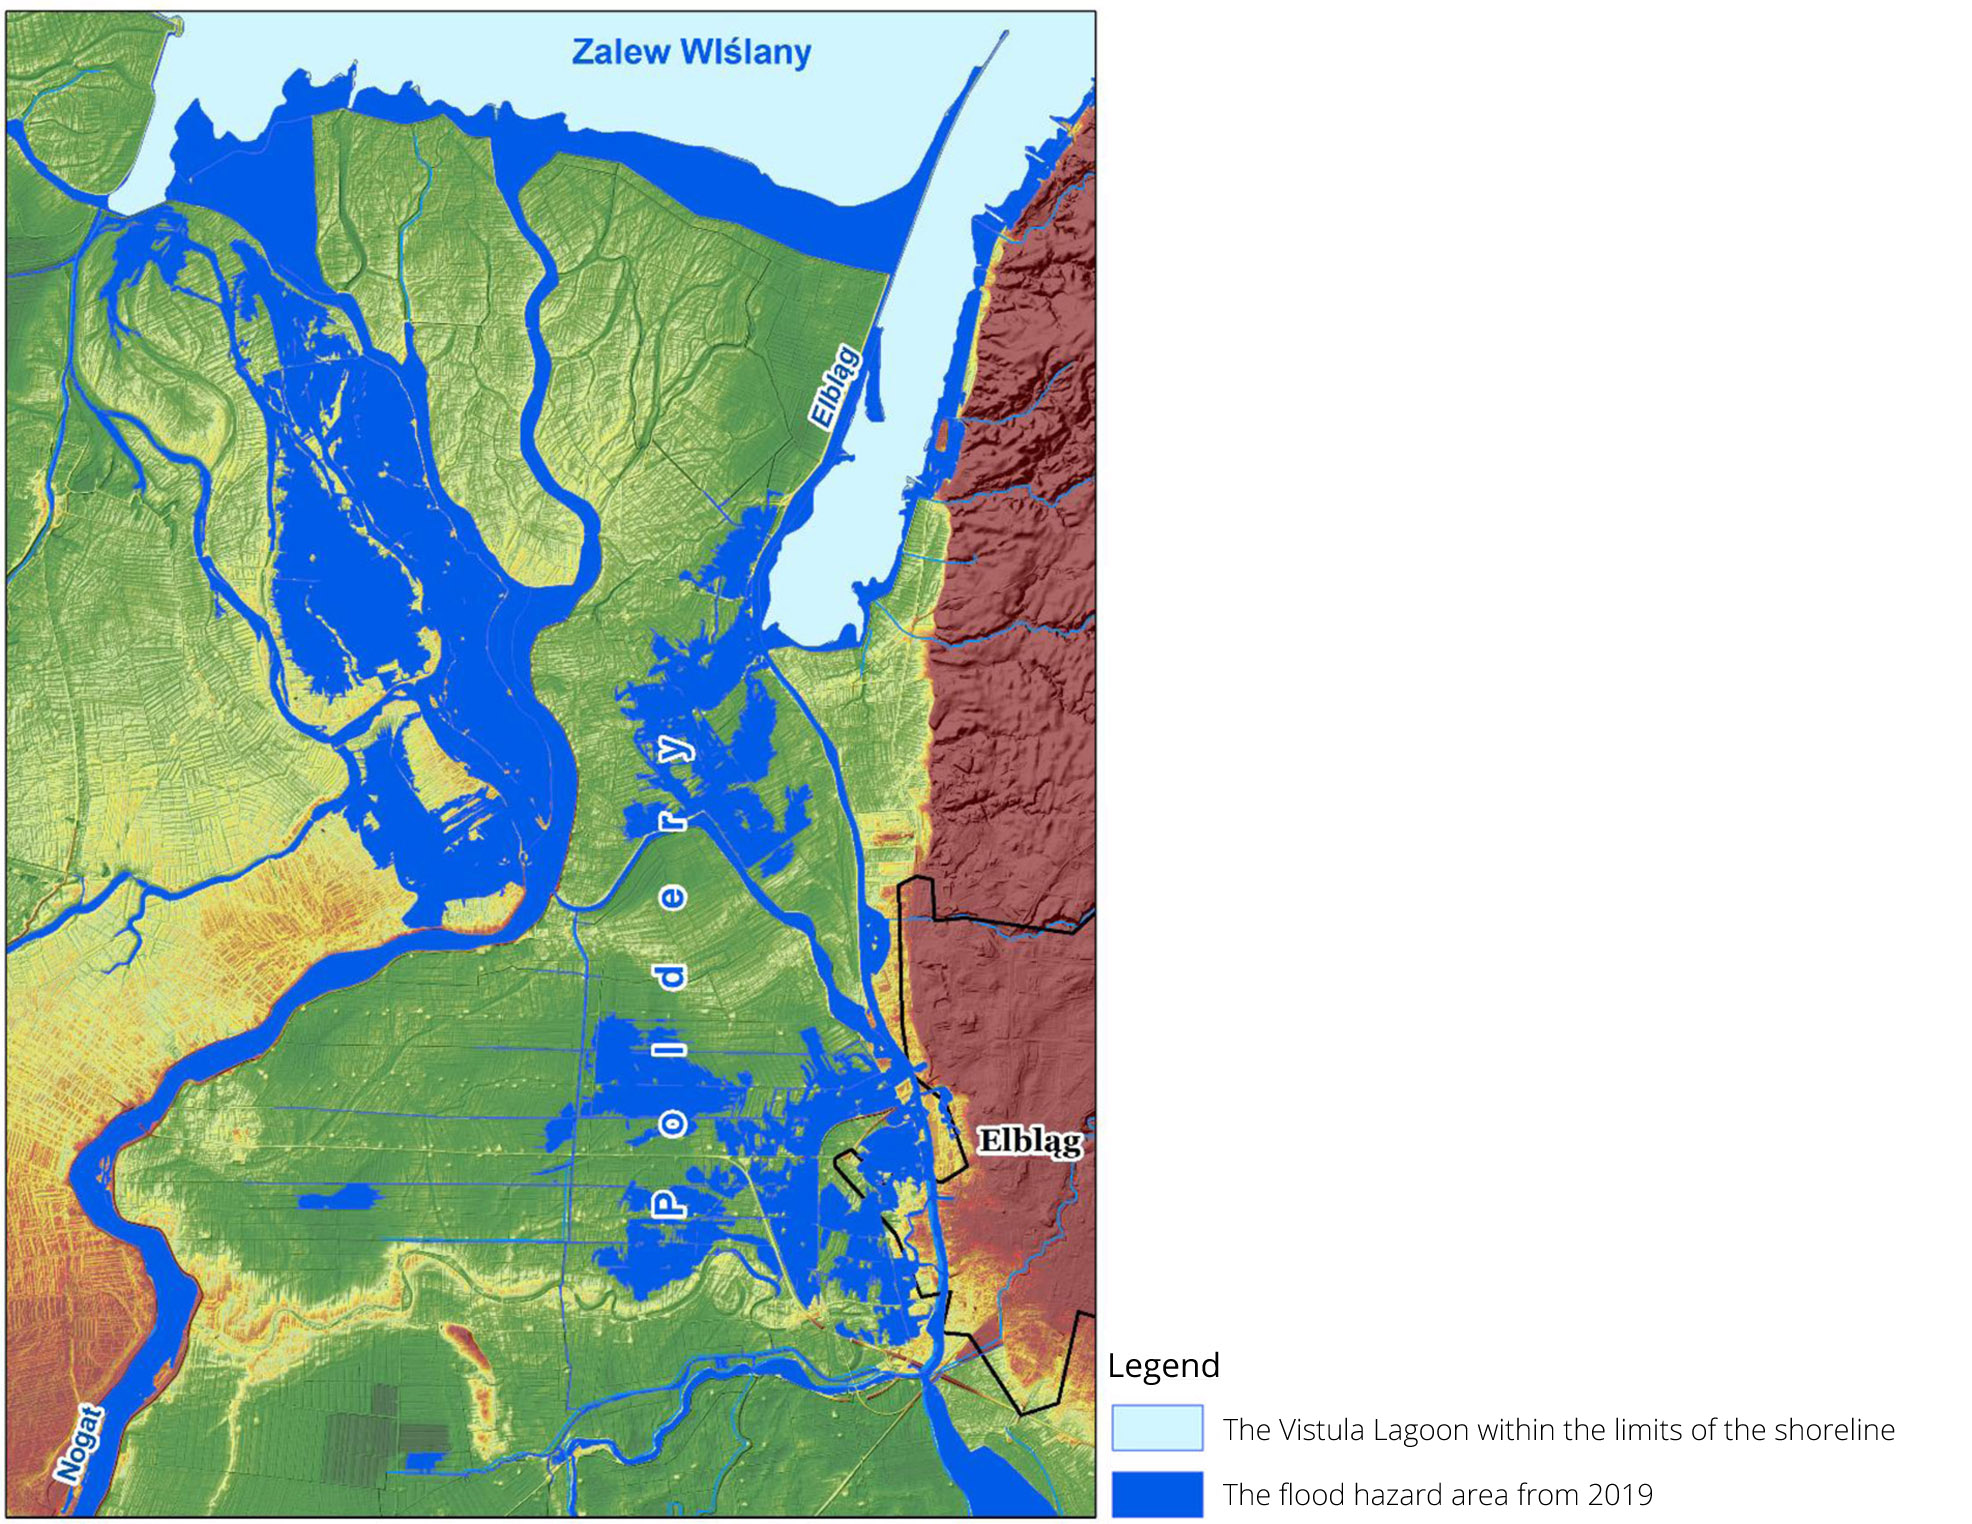
Designation of flood risk areas in the second cycle of flood hazard maps
The second cycle of developing flood hazard maps uses the provisions of the modified „Methodology for the development of flood hazard maps …” prepared in 2017-2019. For a storm flood with a probability of exceeding p = 1% (once every 100 years) in the estuary section of the Elbląg River, the following boundary conditions for mathematical hydrodynamic models were adopted:
- Zp1% = 1.61 m above sea level, as the maximum level of internal sea waters (the Vistula Lagoon), determined as a result of statistically and probabilistically processed observational data;
- determination of the shape of a hypothetical wave based on six historical storm surges;
- addition of 5 cm as equivalent to the mean sea level rise due to climate change for the Vistula Lagoon (IPCC scenario: A2 Mean sea level rise until 2030);
- a time-varying mean wind was introduced, ranging from 0 to 25 m/s, perpendicular to the shoreline, based on observation data from three storm floods.
When comparing the boundary conditions, wind speed is the main factor affecting the extent of the flood hazard. While in the modeling in the first planning cycle, the value of the boundary condition was assumed as a constant value with a speed of 10 m/s, in the second planning cycle, the analysis of the time-varying mean wind speeds during storm floods was included (the value of the wind speed varied in time from 0 to 25 m/s).
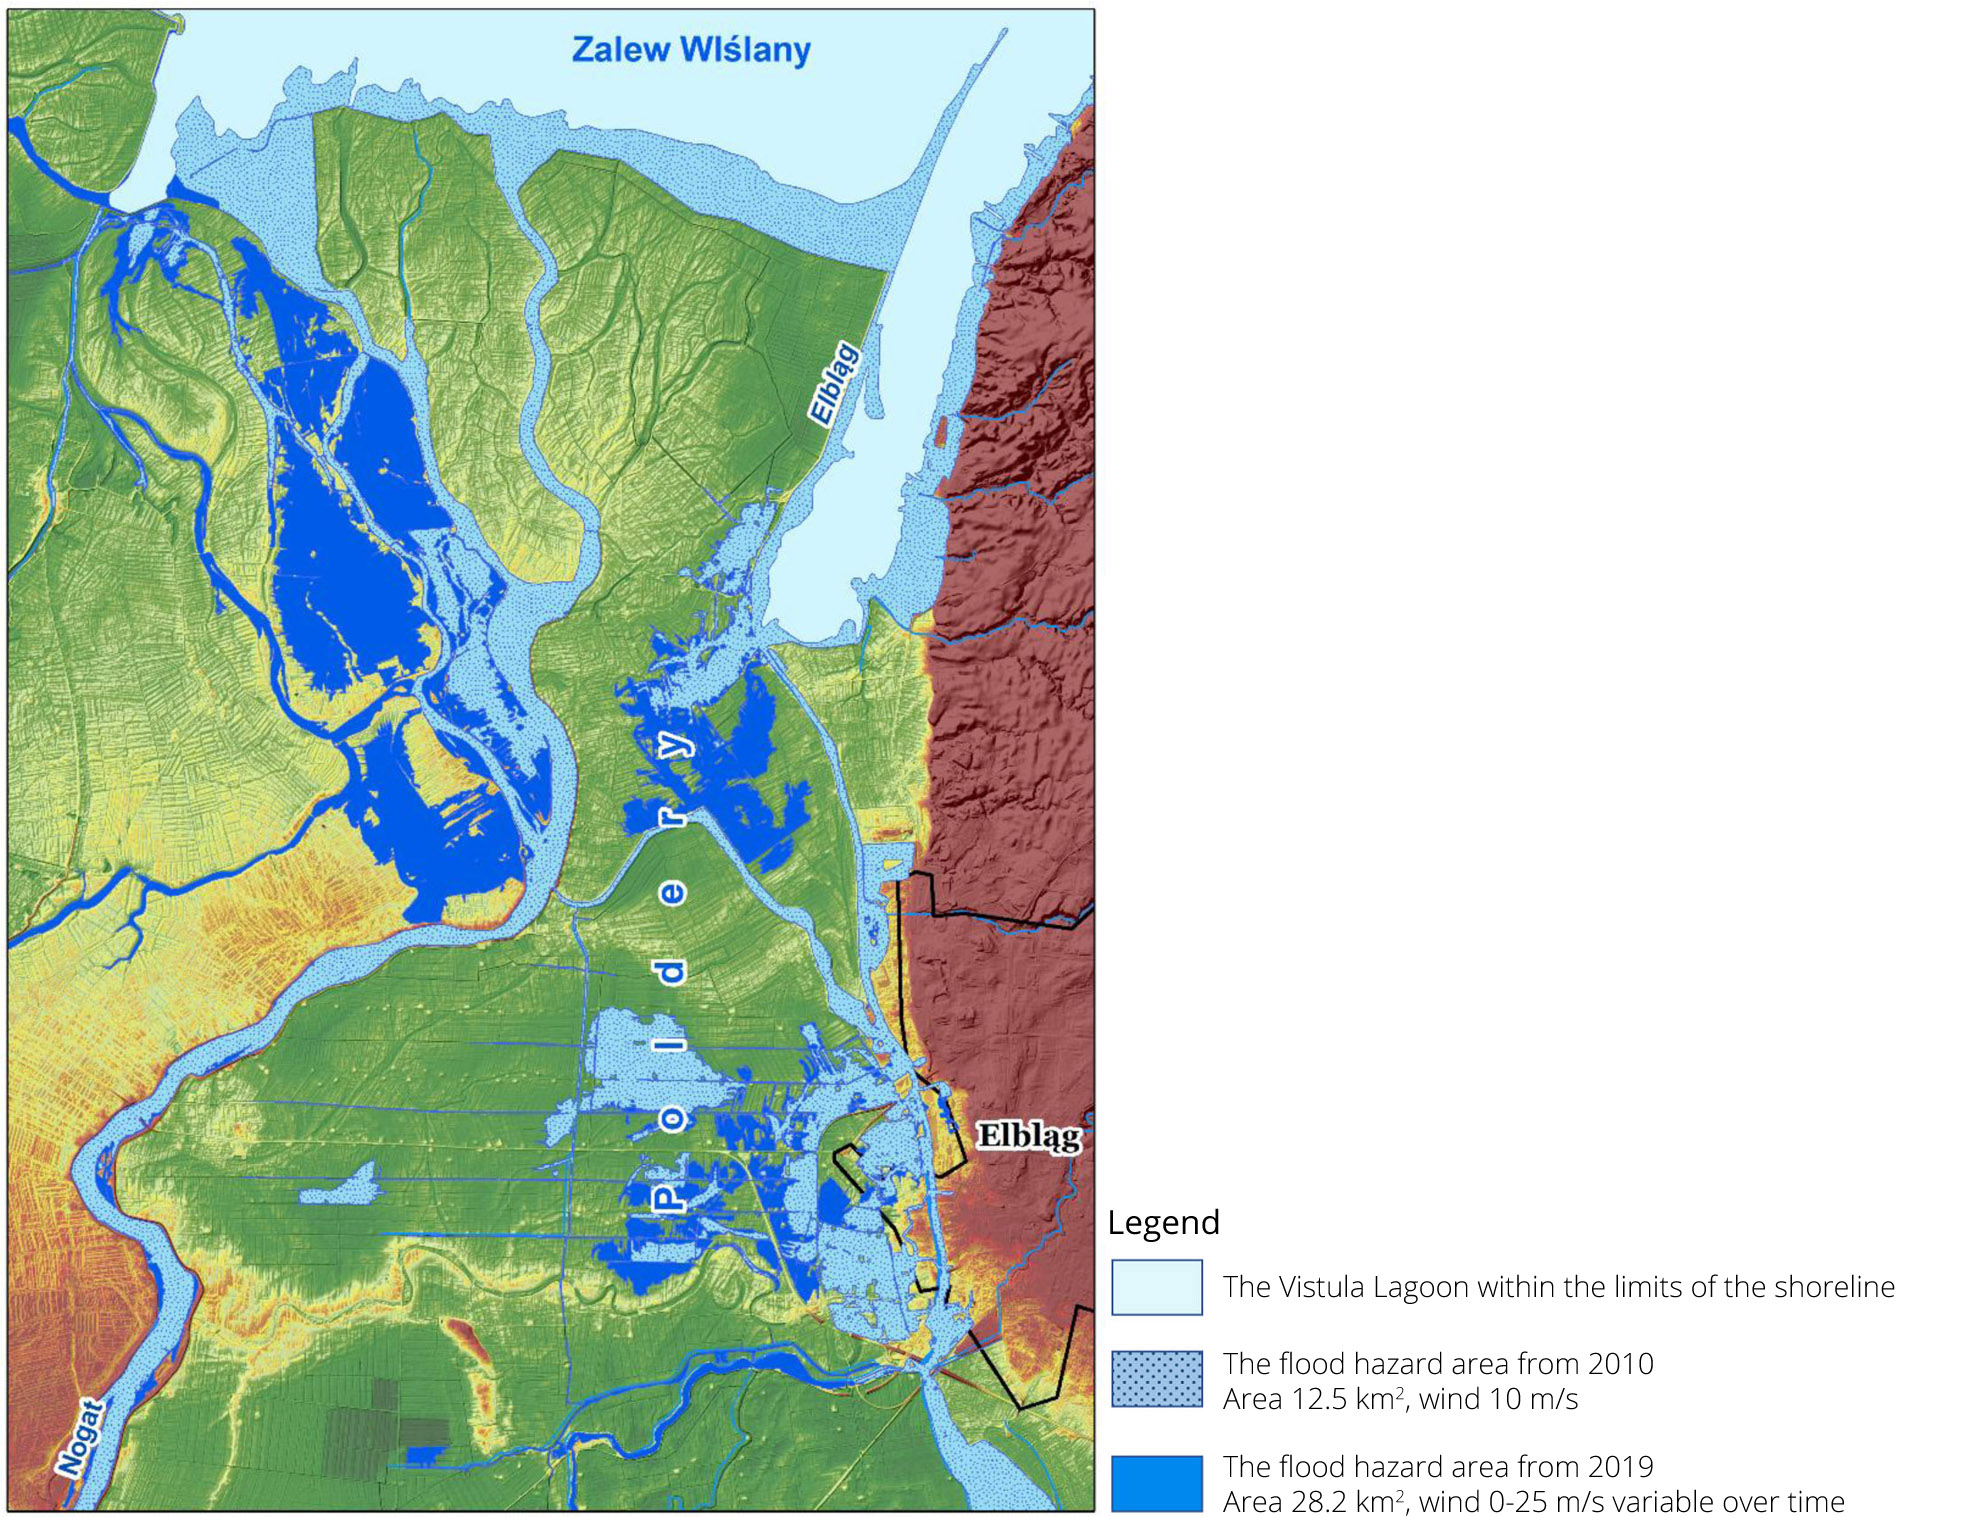
Conclusions on the boundary conditions for determining the flood hazard from sea waters
The comparison of the extent of the flood hazard area from the waters of the Vistula Lagoon with the probability of exceeding p = 1% indicates that the most significant factor of this process is the appropriate determination of the boundary conditions.
1. Determination of maximum values of water levels with a defined probability of exceedance.
In the case of marine and internal marine waters, the method of determining the maximum probable levels should be modified. Currently, they are established based on an analysis of at least 30-year observation sequences. This approach does not seem to be entirely the right solution, as the presented examples of historical storm floods in the Baltic Sea show that all these events should be considered when preparing the maps. Therefore, the procedure for determining the maximum probable sea levels should be extended to historical events that occurred beyond the specified 30-year observation period.
2. Variable parameter is represented as mean sea level increase due to climate change.
Both methods used to model flood hazard areas assumed a 5-centimeter increase in the mean sea level in the Vistula Lagoon. This value seems to be significantly underestimated in the context of flood designation, the theoretical occurrence of which has been estimated once every 100 years. The presented examples include the increase in the mean sea level, which is likely to appear as early as 2030.
According to the 2007 IPCC report, the probable mean sea level rise in 2090 will be between 0.18 and 0.59 m, depending on the climate change scenario. However, the latest report from 2021 indicated that the global increase in the mean sea level in the years 2081-2100 could be as follows:
- RCP2.6 scenario: 0.26-0.53 m (mean 0.39 m);
- RCP8.5 scenario: 0.51-0.92 m (mean 0.71 m).
Therefore, it seems that this element of boundary conditions for floods from the Baltic Sea should be within the limits of at least the RCP2.6 scenario for the probability of a flood occurring once every 100 years and under the RCP8.5 scenario for a flood with a probability once every 500 years. Furthermore, according to point B.3.4. of the IPCC report (2019) Summary for Policymakers: “The increase in mean sea level will increase the frequency of extreme sea level phenomena in most locations around the globe. Historically occurring once in a century, local sea levels are predicted to occur at least once a year in most places by 2100 in all scenarios under consideration and have a high level of reliability”. In the first version of the methodology from 2010, the IMGW proposed to assume the mean sea level rise of 35 cm due to climate change.
3. Wind in boundary conditions.
None of the methods presented considers the wind factor in the aspect of future climate change, i.e., the potential increase in wind gusts and the increase in mean wind speeds during future storm floods. According to point B.3.5. of the IPCC report (2019) Summary for Policymakers: „Significant wave heights are predicted to increase in the Southern Ocean and tropical Eastern Pacific (high confidence) and the Baltic Sea (medium reliability).” In addition, point B.9.1 states that: „(…) The annual coastal flood damage is expected to increase by 2-3 orders of magnitude by 2100 compared to the present situation (high confidence)”.
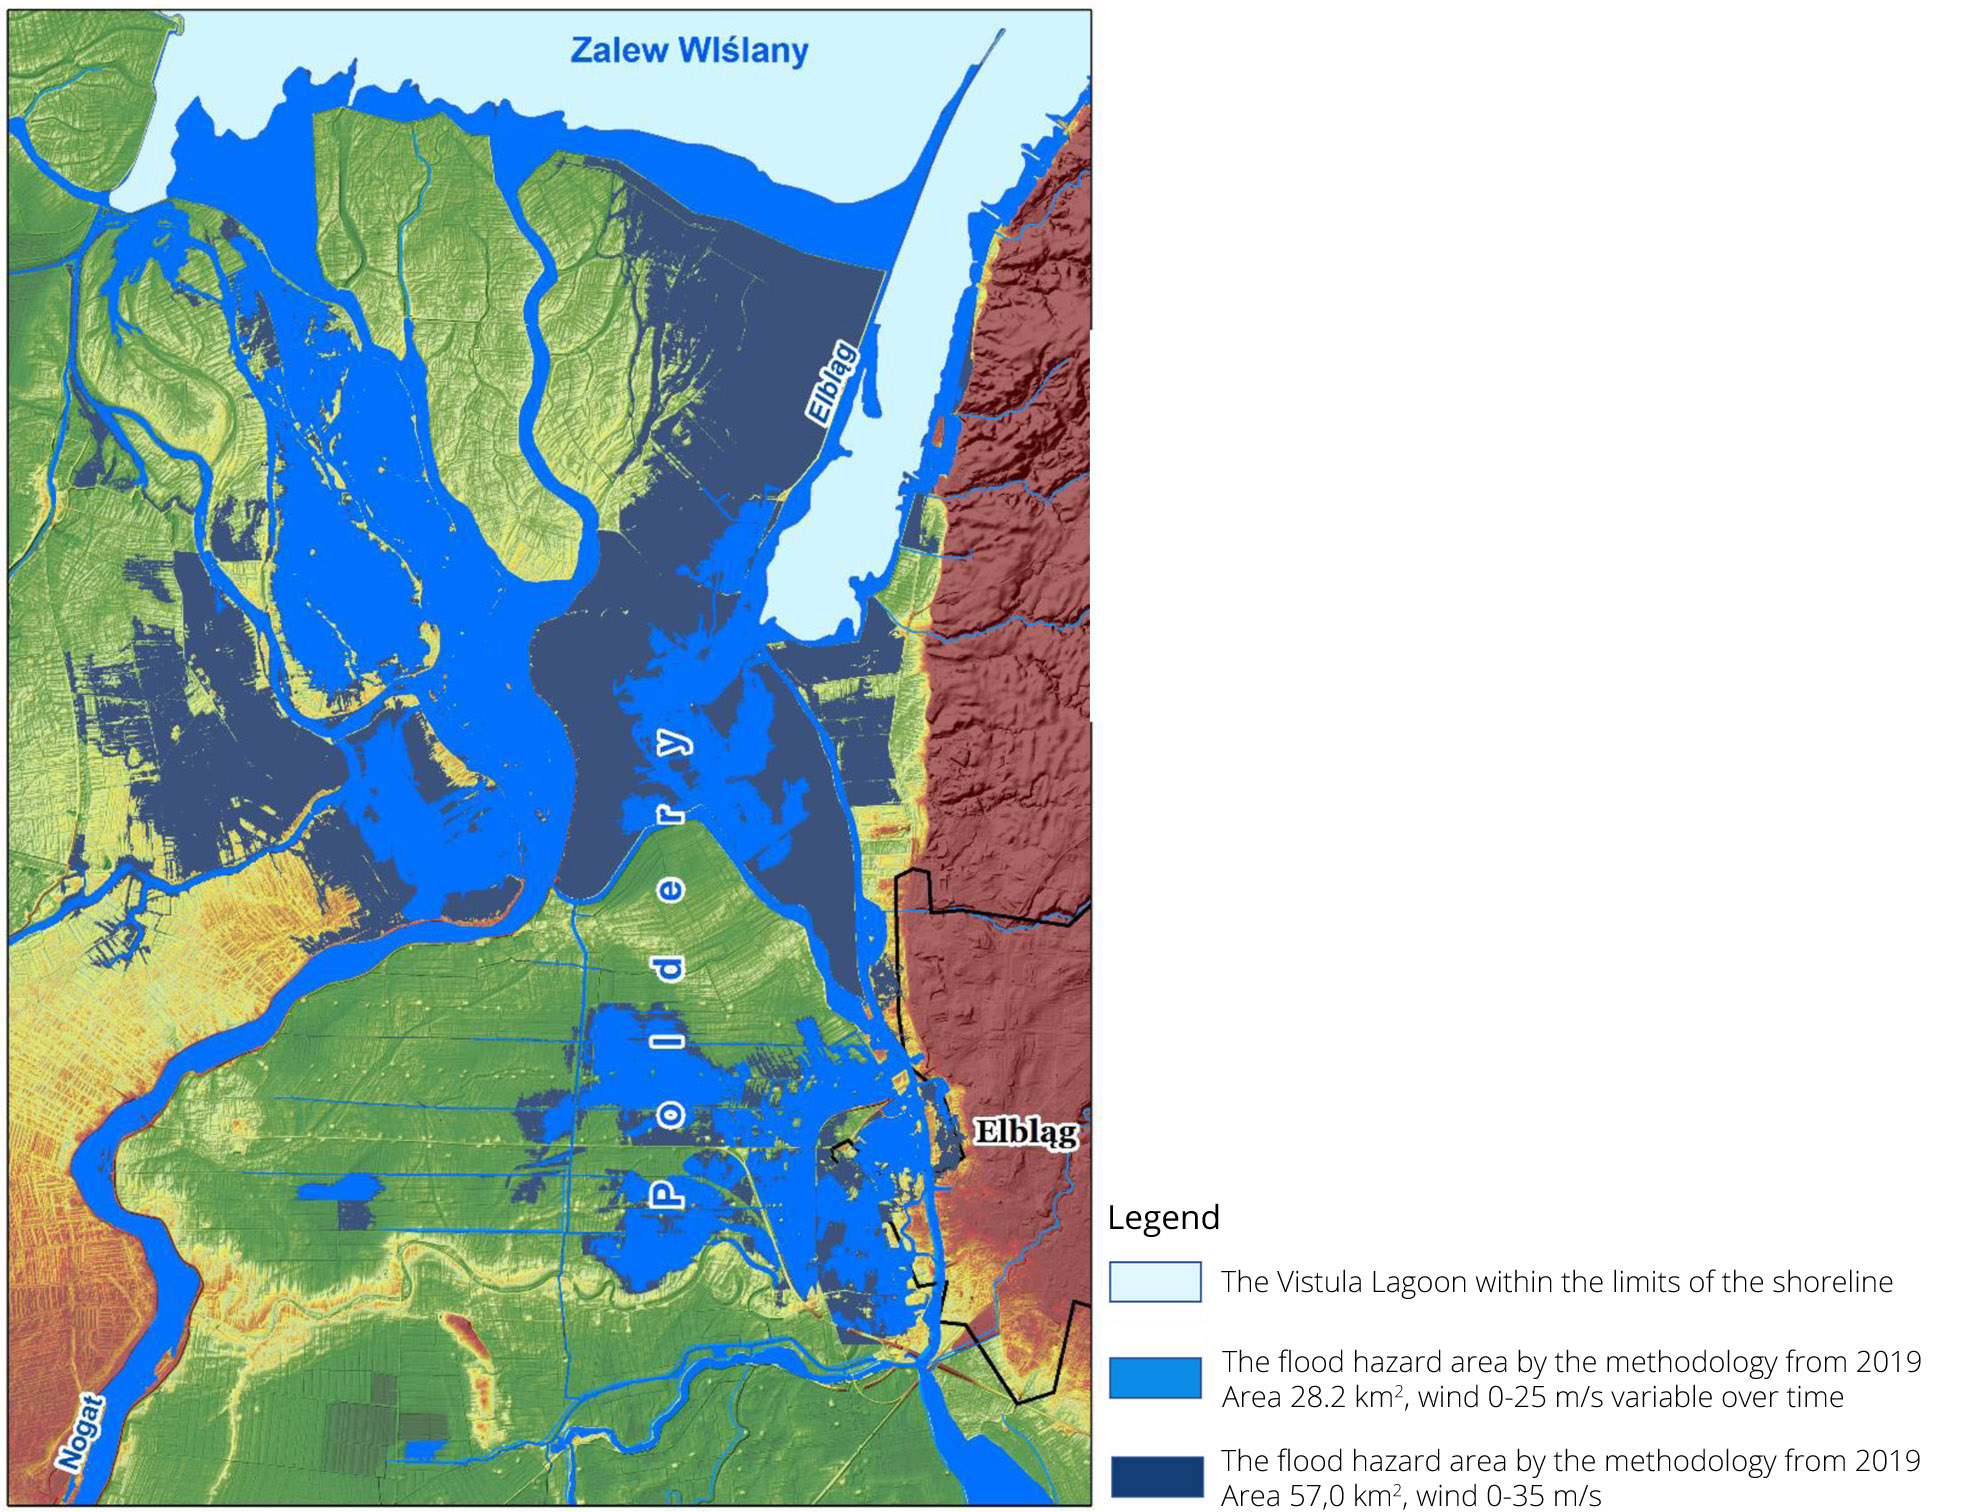
Due to the possible increase in mean and maximum wind speeds caused by climate change, calculations were made for the scenario where maximum wind speed was increased to 35 m/s.
The map shows a comparison of the flood hazard extents layers implemented on the basis of the methodology from 2019 using an additional calculation scenario in which the maximum wind speed in the peak of the storm surge was increased to 35 m/s. The difference in the area of flood hazard extents between the scenario with the maximum wind of up to 25 m/s and the wind of up to 35 m/s is approximately 28.8 km2.
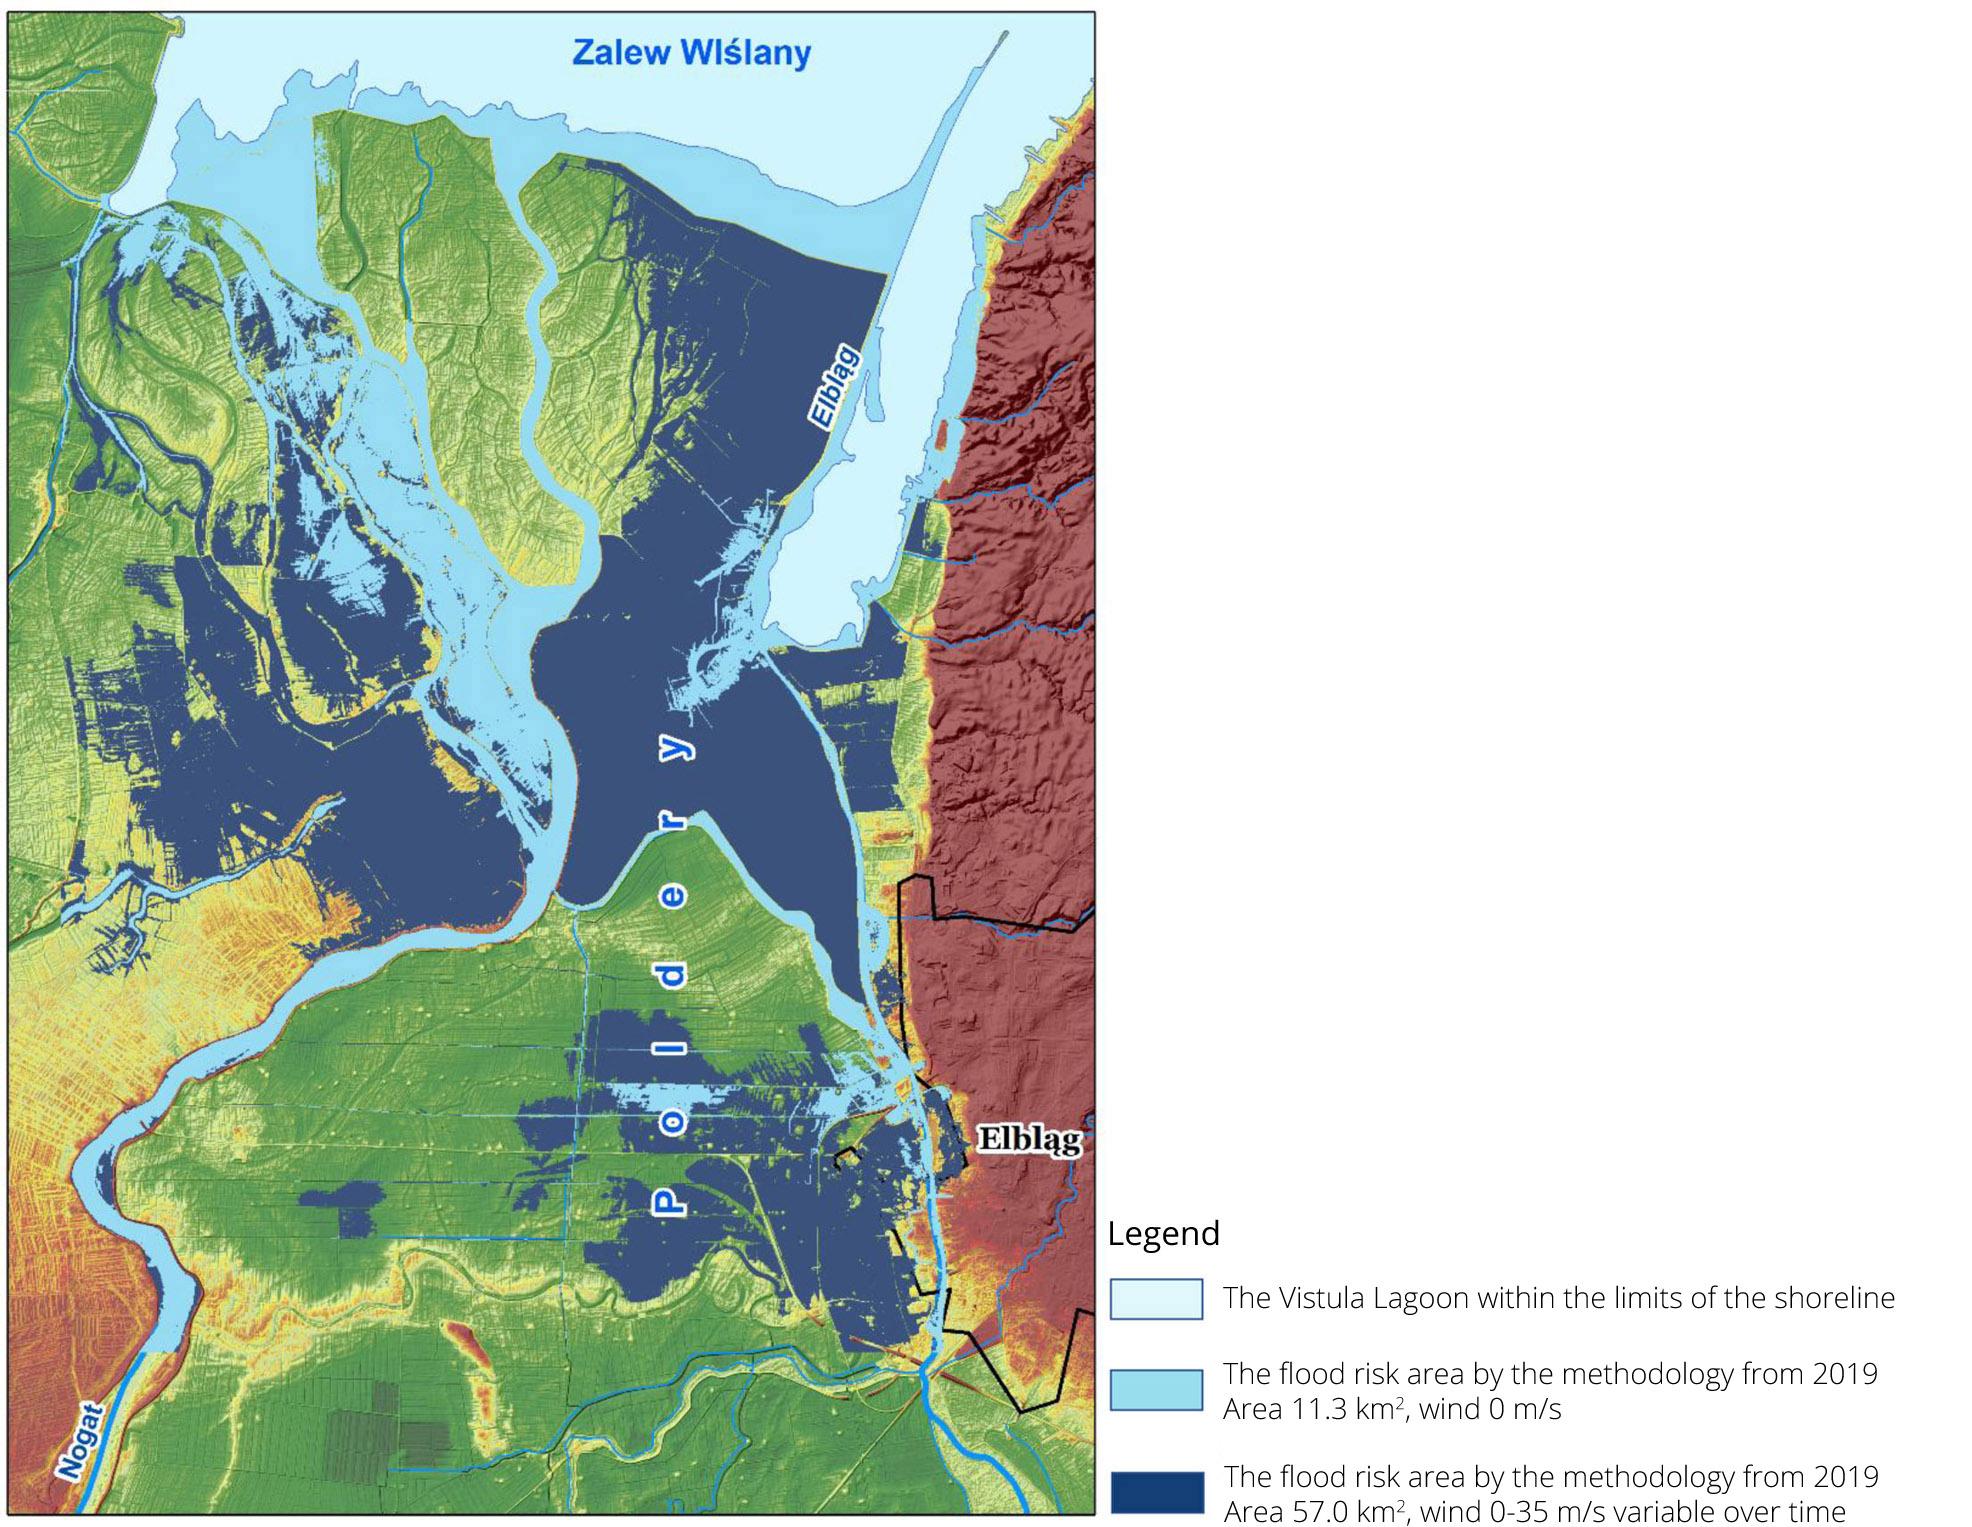
The map below compares the two result layers of flood hazard extents for a hypothetical wave with the probability of exceeding p = 1%, based on the methodology from 2019 for a zero wind scenario and an additional calculation scenario where the maximum wind speed in the peak of the flood was increased to 35 m/s. The modeling of the zero-wind scenario was carried out to emphasize the necessity of using this boundary condition. It should also be emphasized that the abandonment of the boundary condition in the form of wind does not allow for achieving the calibration of the storm surge model. It means that the model does not correctly reflect changes in the surface water table level over time on the calibration water gauge unless the boundary condition in the form of a time-varying wind is introduced.
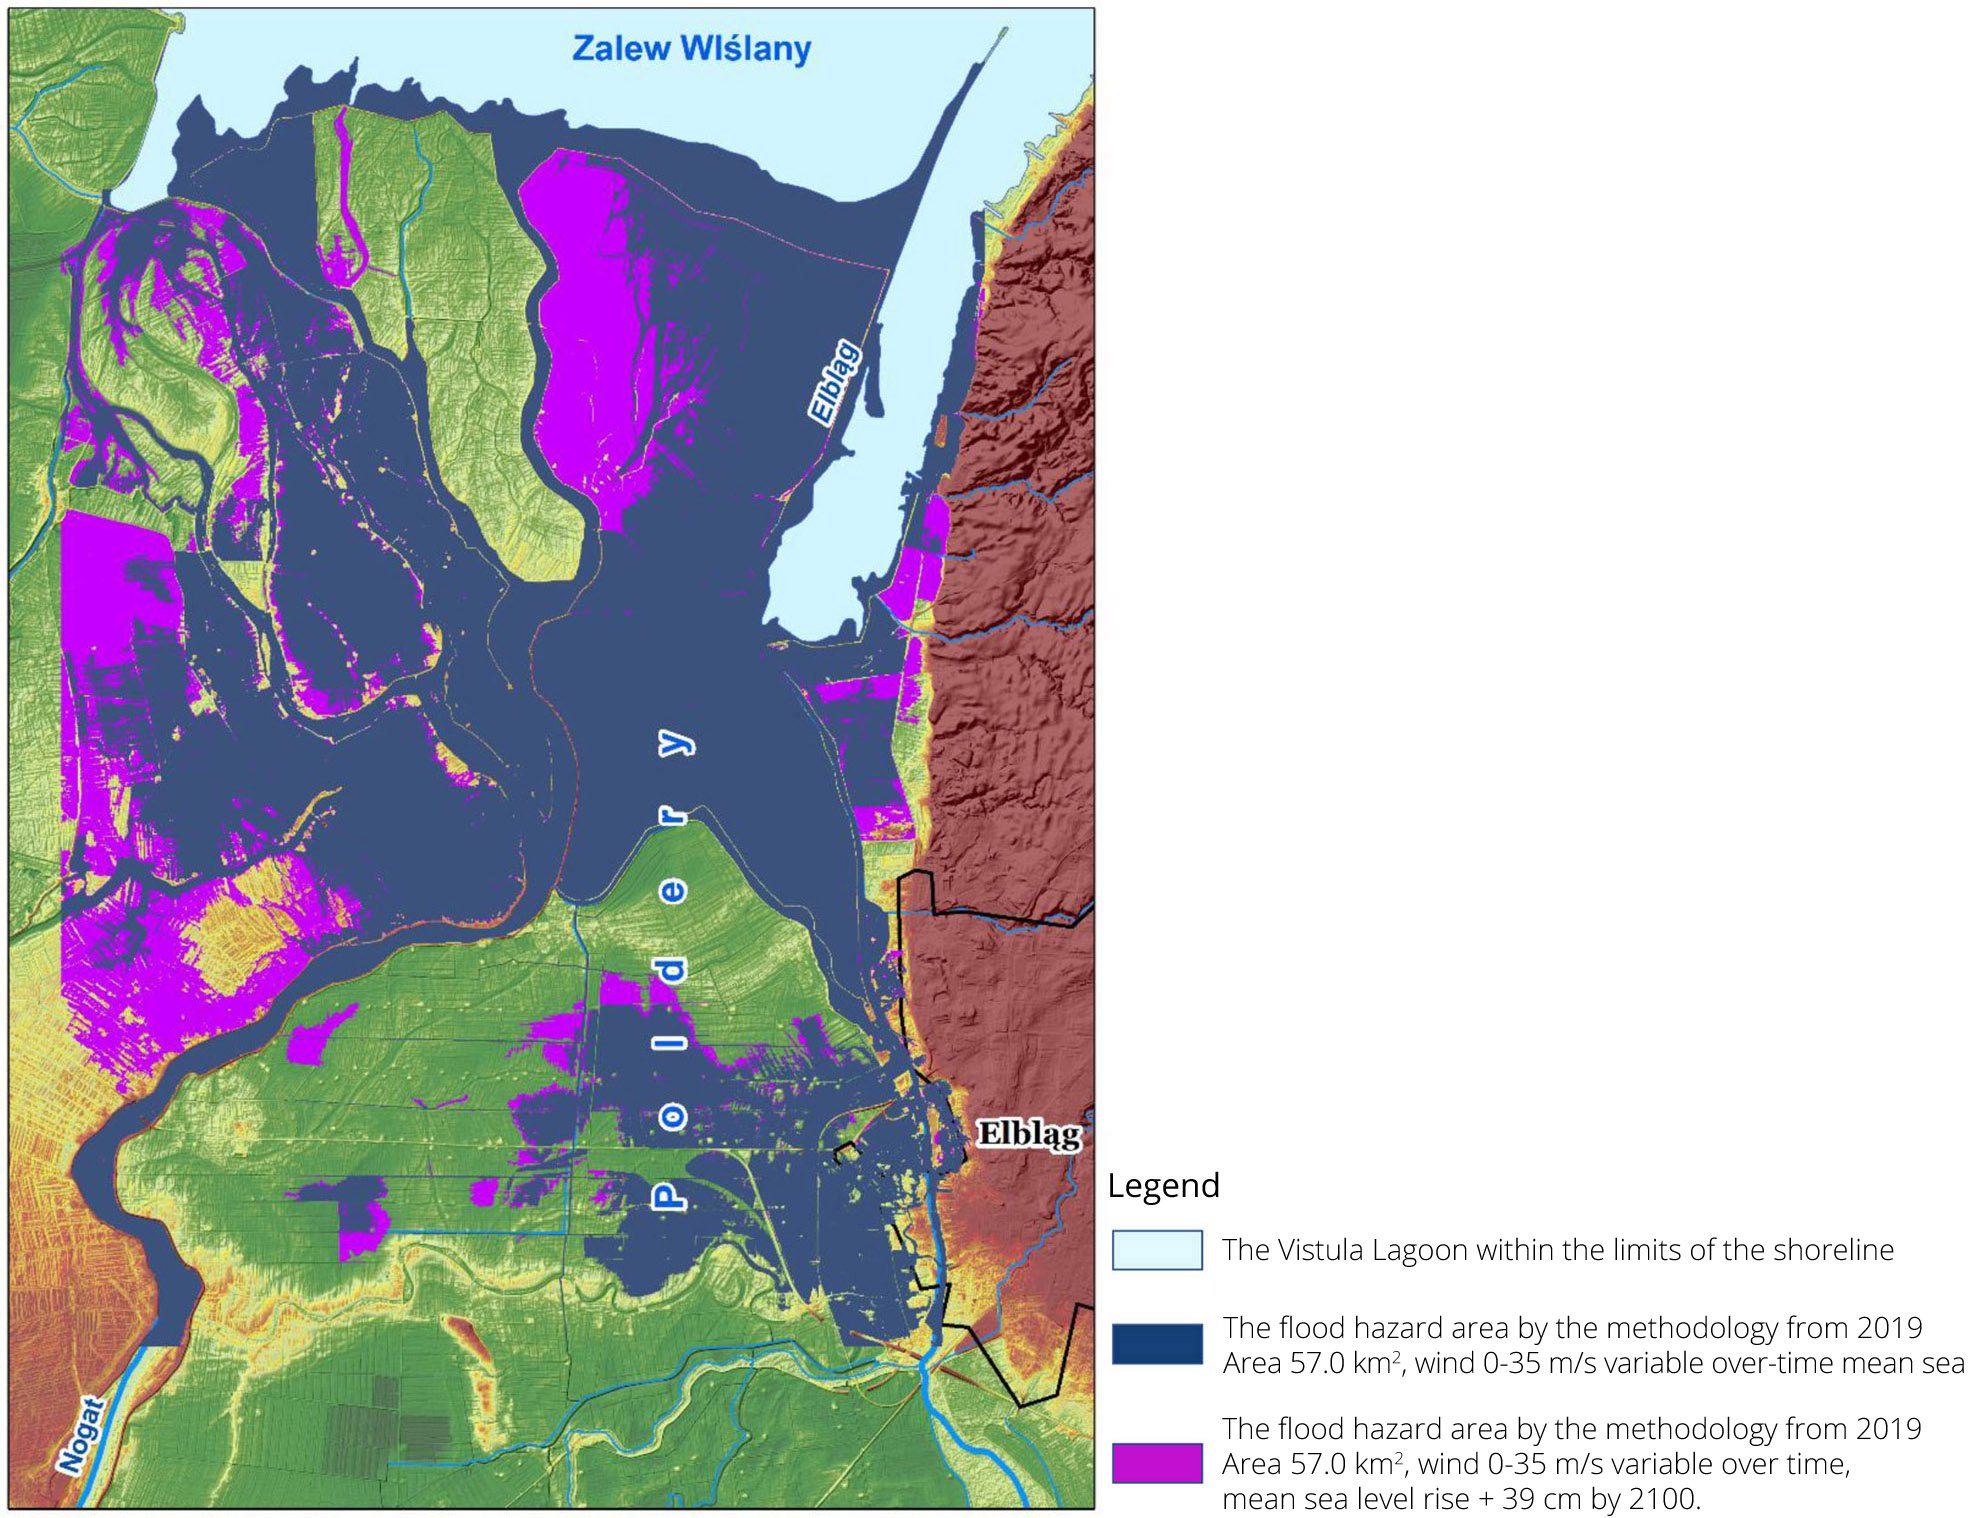
An alternative scenario for flood hazard p = 1% (once every 100 years) according to the medium RCP2.6 scenario and the forecasted increase in wind speed up to 35 m/s
A hypothetical flood hazard scenario from internal marine waters was developed, based on previous analyzes, methodologies, and estimated increases in mean sea level by 2100 and the frequency of storms with a probability of occurring once every 100 years (according to the IPCC report). It includes an increase in mean sea level and mean wind speed.
The map below compares the result layers of flood hazard extents for a hypothetical wave with a probability of exceeding p = 1%, based on the methodology from 2019 for the scenario with the maximum wind speed in the peak of the storm surge up to 35 m/s and an increase in mean sea level by 5 cm, and the same scenario complemented by an increase in the mean sea level to 39 cm by 2100. The difference in the area of flood hazard extents between the scenarios is well above 17.4 km2 (hazard flood area over 74.4 km2). A more accurate estimation would require a complete redesign of the model due to the hazard reaching the western border of the model. When analyzing the topography near the model border, it can be assumed that the area not included in the model should not exceed a total of 2 km2.
The purpose of the alternative scenario is to show the implications and significance of considering the sea level rise to 2100 when determining the flood hazard for a hypothetical wave with the probability of exceeding p = 1% (once every 100 years). The time-consuming process of model extension was therefore omitted.
As shown in the example presented for Żuławy Elbląskie, the findings of the IPCC report 2021 should be taken into account when drawing up the future guidelines for determining flood hazard from sea waters and internal maritime waters. Furthermore, historical records of disasters caused by hurricanes and storm surges indicate a further need for research into forward-looking propositions of statistical and probabilistic methods for assessing extreme height increases and the shape of hypothetical storm waves. In particular, attention should be paid to the wind factor, the main force causing storm floods, and future sea level rise as a boundary condition in hydrodynamic modeling. The ongoing climate change significantly determines the hazard of storm surges. This issue should not be underestimated because storm phenomena directly lead to human deaths and huge losses in infrastructure and livestock.
Author: Janusz Topiłko | National Hydrological Protection Centre, IMGW-PIB.
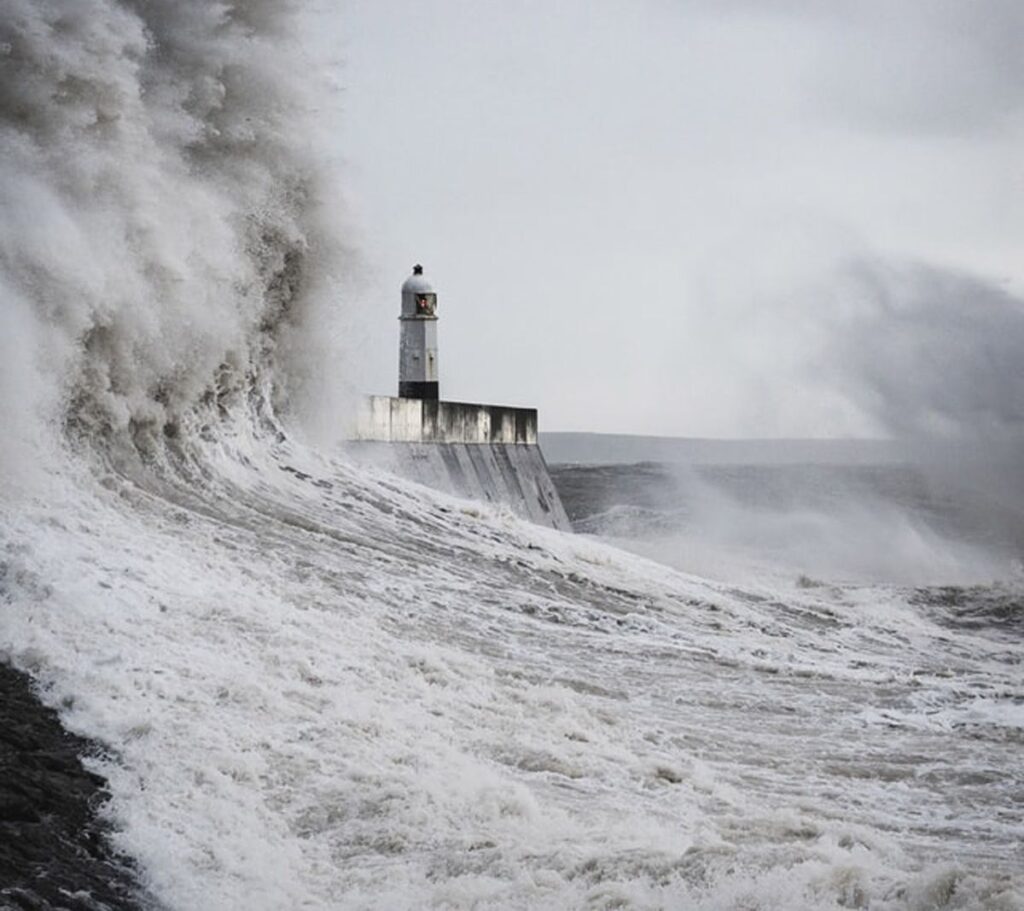
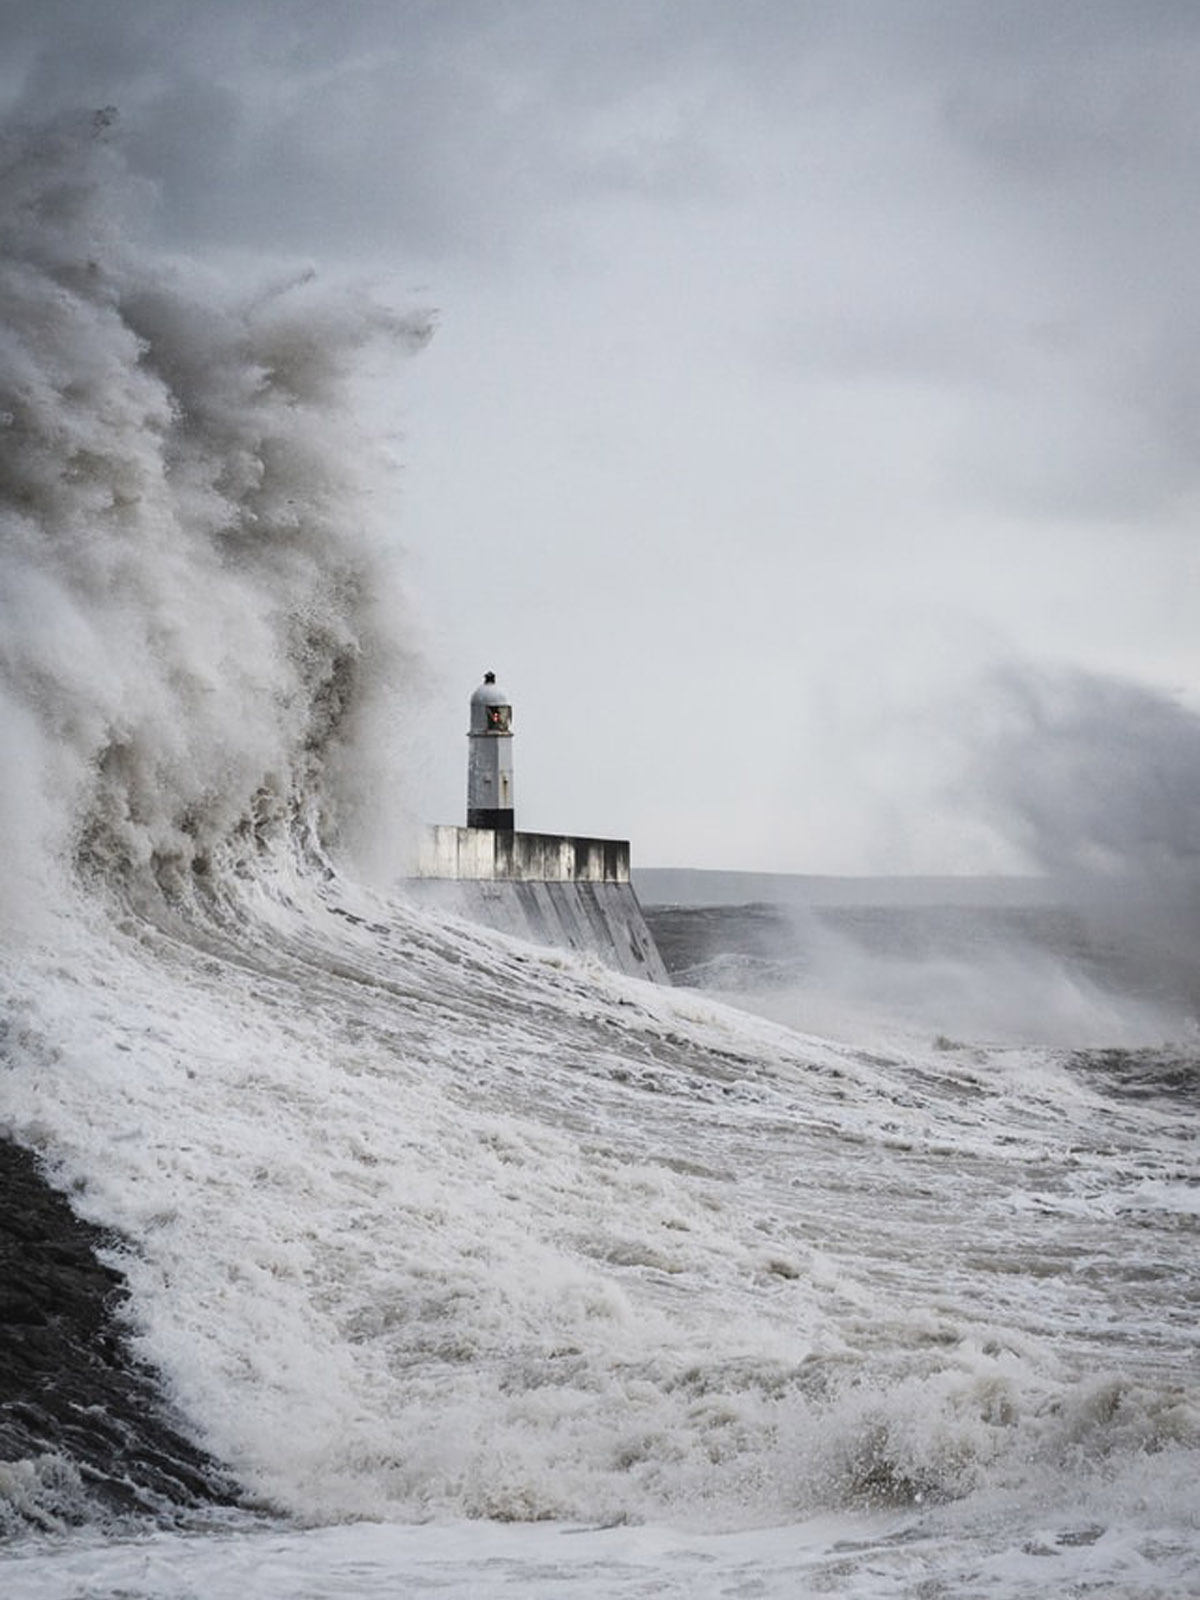
Zdjęcie główne: Marcus Woodbridge | Unsplash