Two years ago, we wrote that winter thunderstorms in Poland are an extremely rare meteorological phenomenon. The beginning of 2022, however, showed how unpredictable the weather is. Due to the dynamic course of the baric systems, the significant pressure differences, and the increased air instability in Europe the past month – although warmer than the long-term normal – brought a whole range of dangerous hydrological and meteorological phenomena: storms, floods, strong winds, with a record gust on Śnieżka of 54 m/s (over 190 km/h!), snow blizzards, glaze, snowfall, rain and snow, rainfall, snow grain and, of course, thunderstorms. It would be too hasty and early to say that the January weather hotchpotch results from a changing climate. However, the analysis of historical meteorological data clearly shows that the climatic conditions in Poland are becoming more and more unstable, which results in an increase in the frequency and intensity of hazardous weather events.
AUTHORS:
Mateusz Barczyk IMGW-PIB/National Meteorological Protection Centre Hubert Łuszczewski,
Sylwia Śmigiera IMGW-PIB/Centre of Hydrological and Meteorological Measurement and Observation Network, Terrestrial Remote Sensing Department
Hubert Łuszczewski, IMGW-PIB/Centre of Hydrological and Meteorological Measurement and Observation Network, Terrestrial Remote Sensing Department
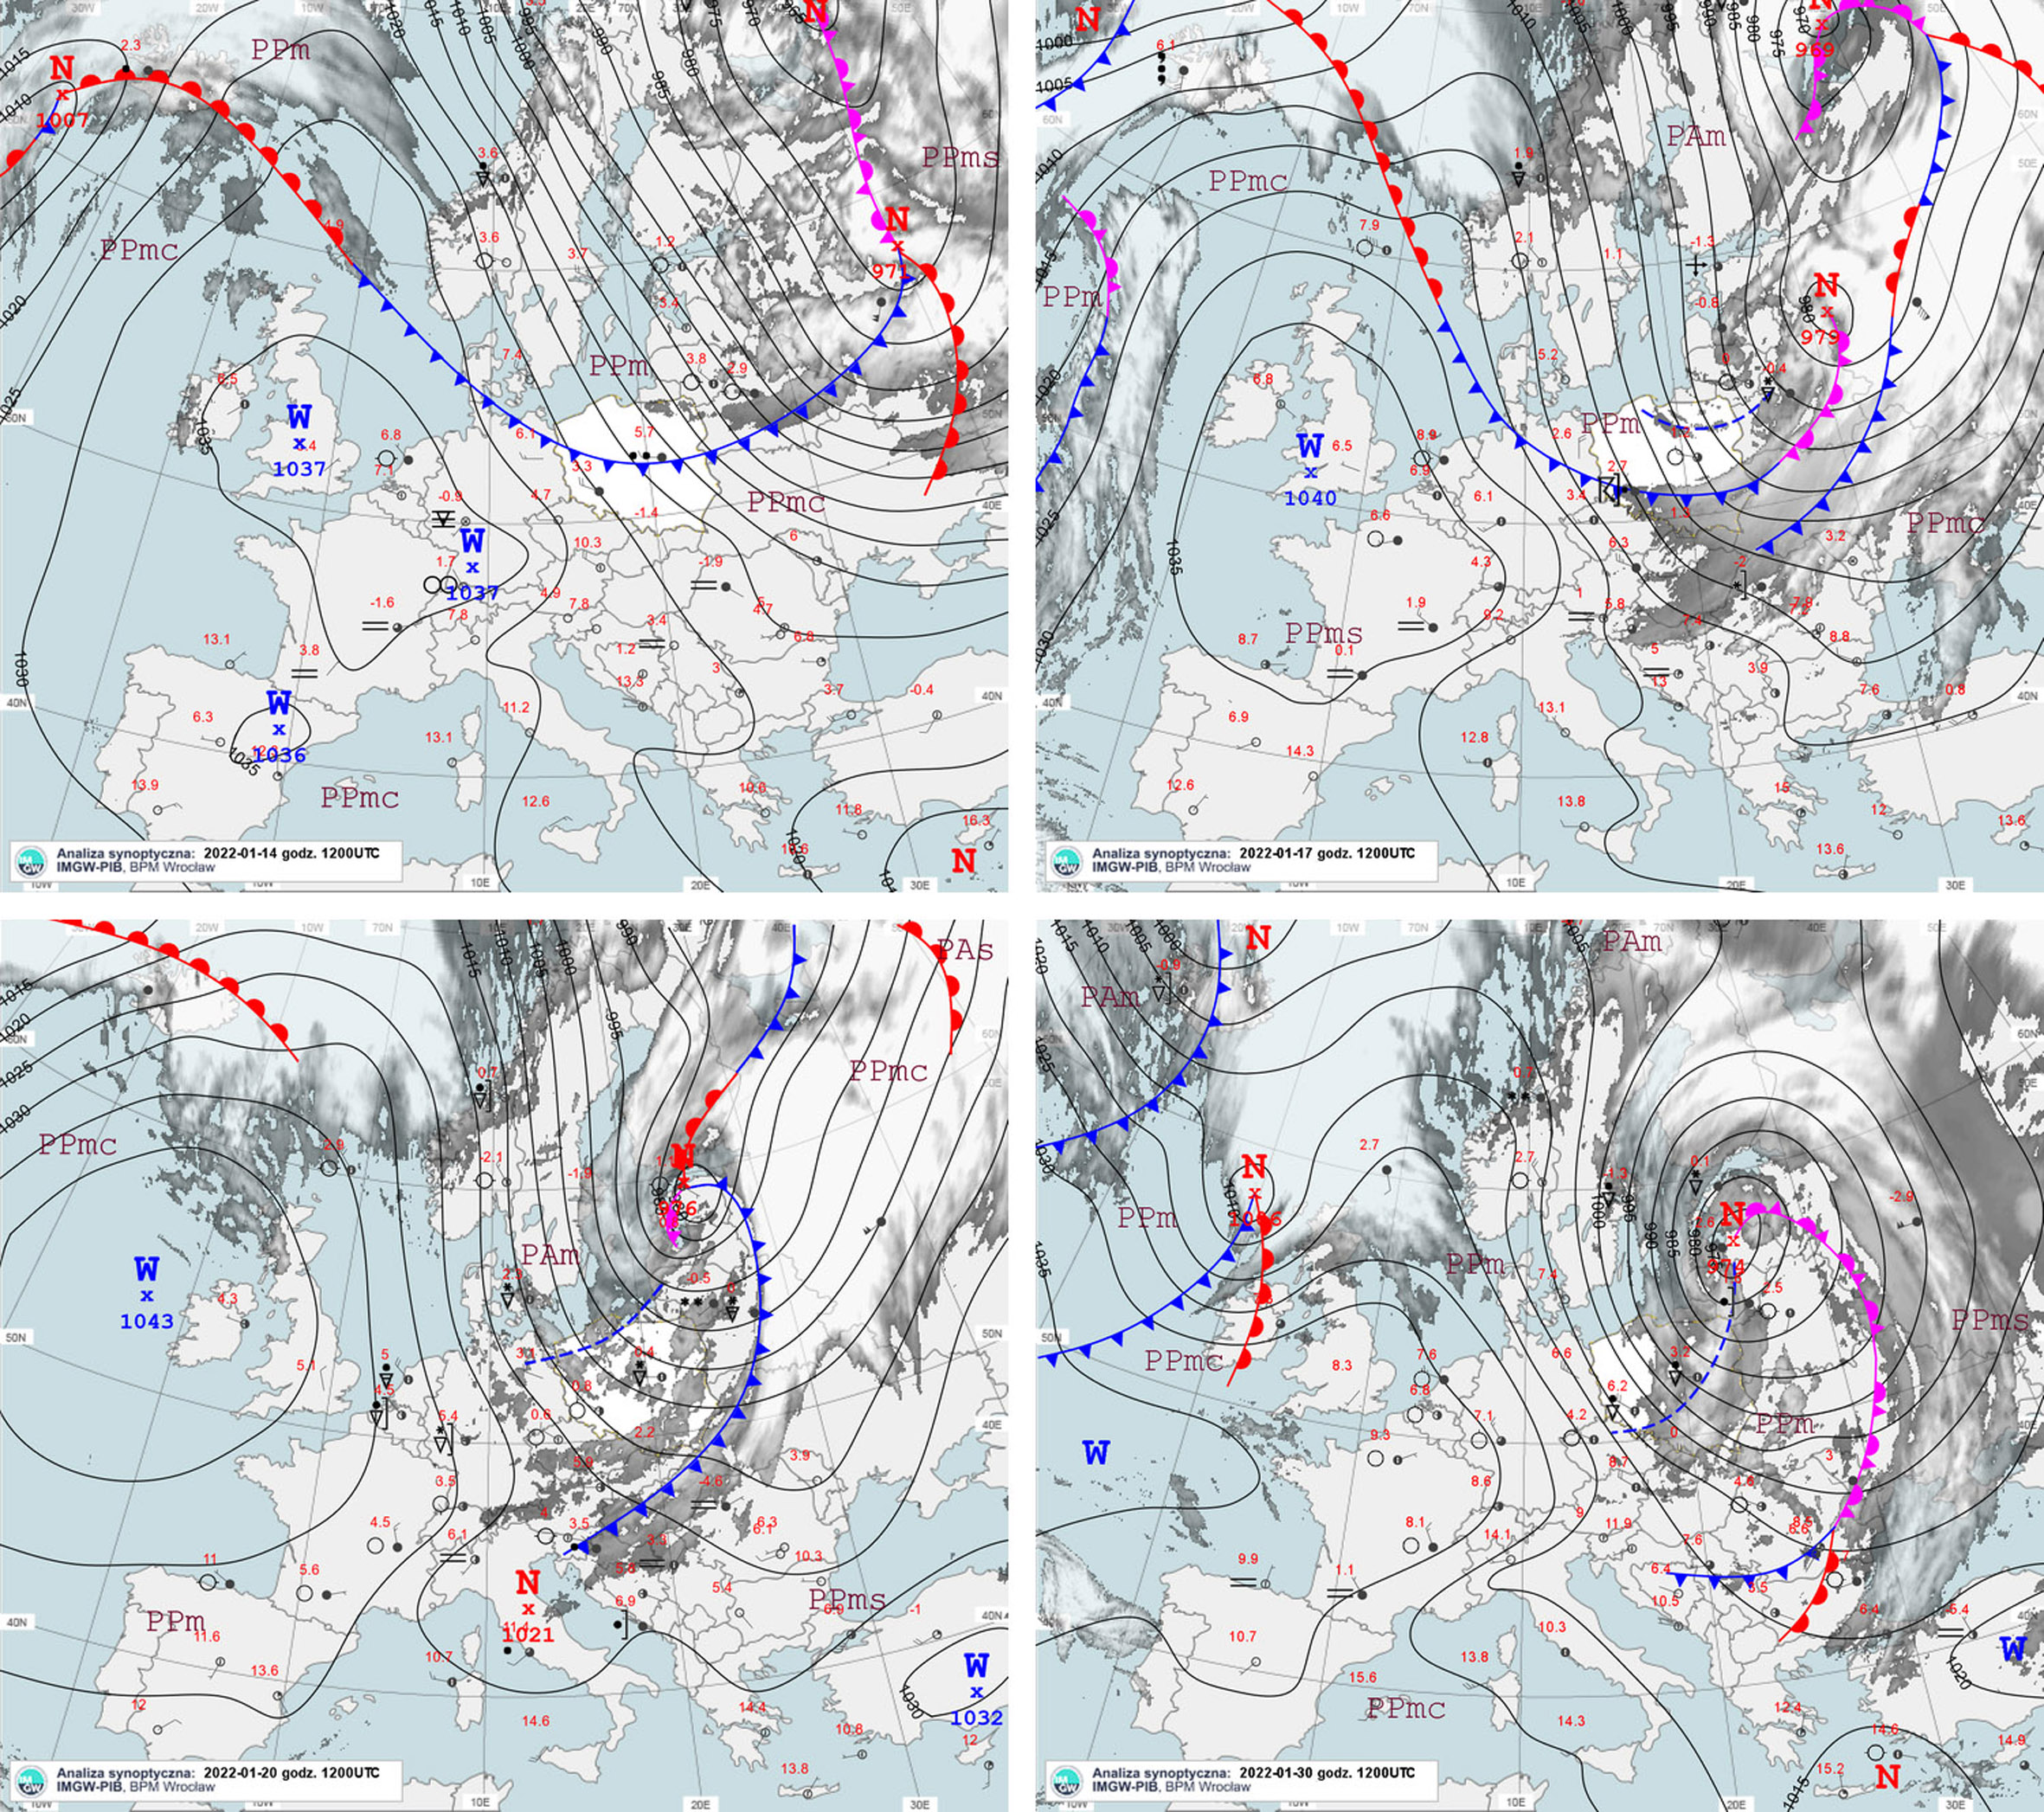
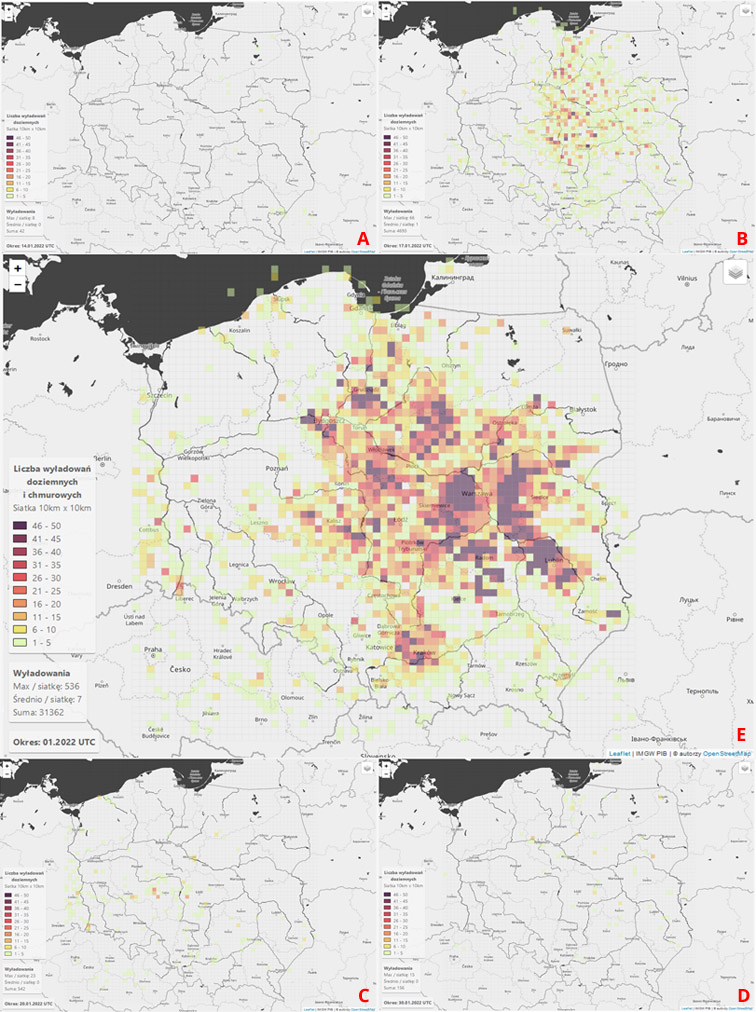
Winter thunderstorms are not a completely new phenomenon in Poland, but there has not been recorded so much storm activity this season for a long time. The aura on January 17 was particularly exceptional when the PERUN system detected over 4,600 ground lightning and nearly 23,000 cloud lightning – ten times more than in the entire record-breaking January 2017. In addition, a greater than a usual number of atmospheric lightning per day was recorded on the 14th, 20th, and 30th day of the month. Interestingly, the observed storm phenomena occurred in a similar synoptic situation (except January 30). The moderately warm mass of polar maritime air over Poland is displaced by the active front with incoming cool and drier, denser air. As a result of the considerable pressure difference, the wind force increases. The conditions in the front zone and behind it become unstable – the air pushed by the wind rises quite easily, and the water vapor accumulated in it becomes saturated and condensed. Cumulus clouds begin to form. Increased frontal activity leads to the development of uplifted Cumulus Congestus and Cumulonimbus clouds, which are higher than the environment, as the satellite images show perfectly (https://obserwator.imgw.pl/burze-zimowe-widziane-z-kosmosu/). The answer to the question of why such intense storms occurred should be sought in the diagrams of the vertical system of the atmosphere.
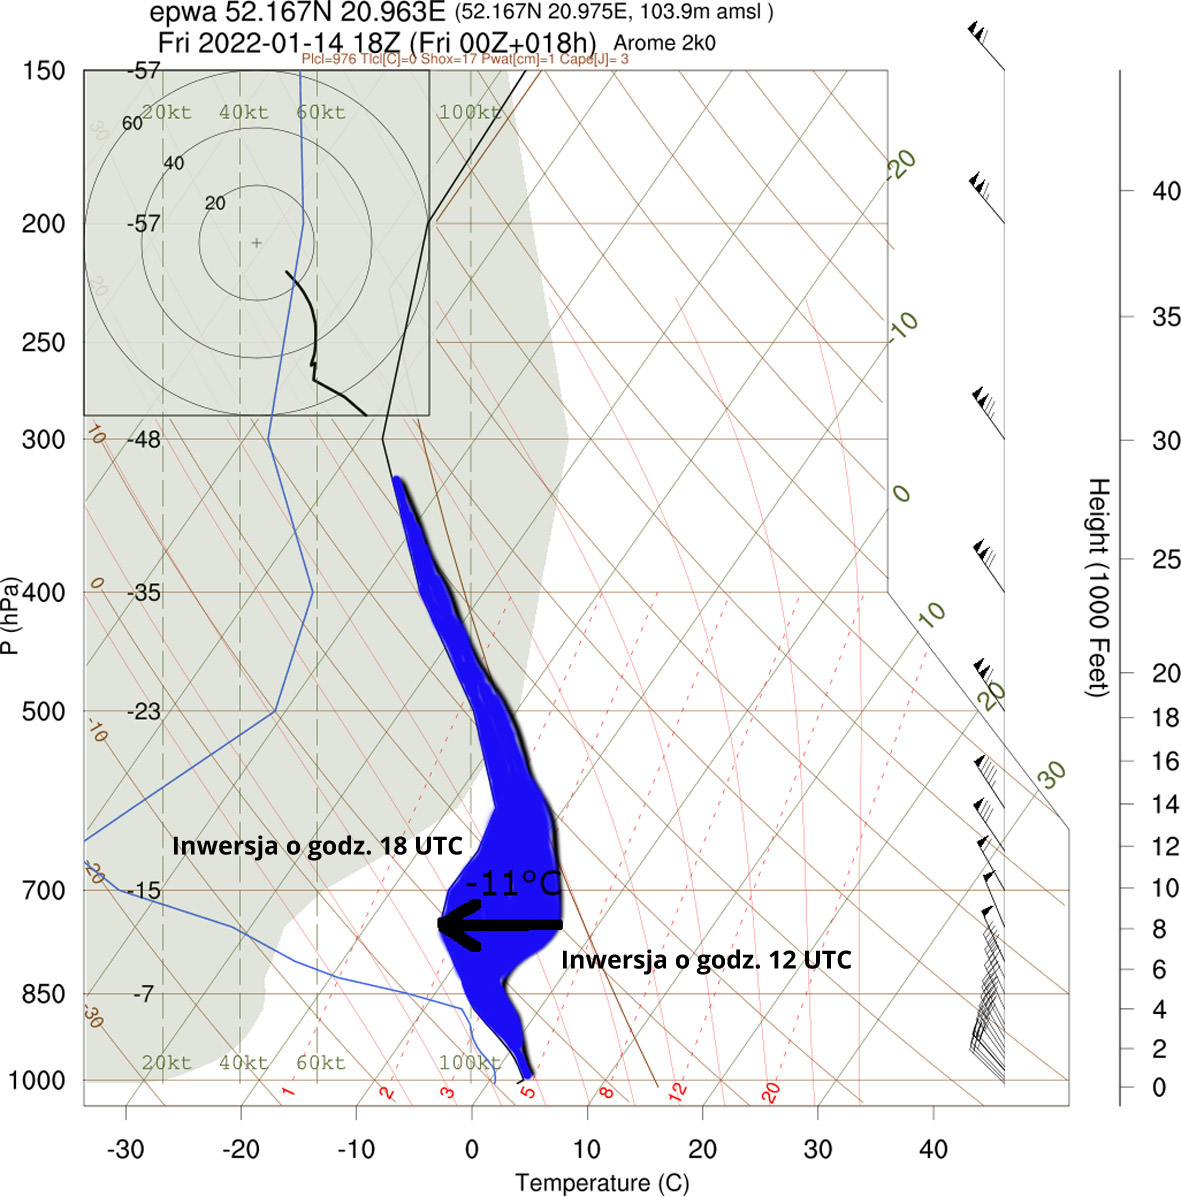
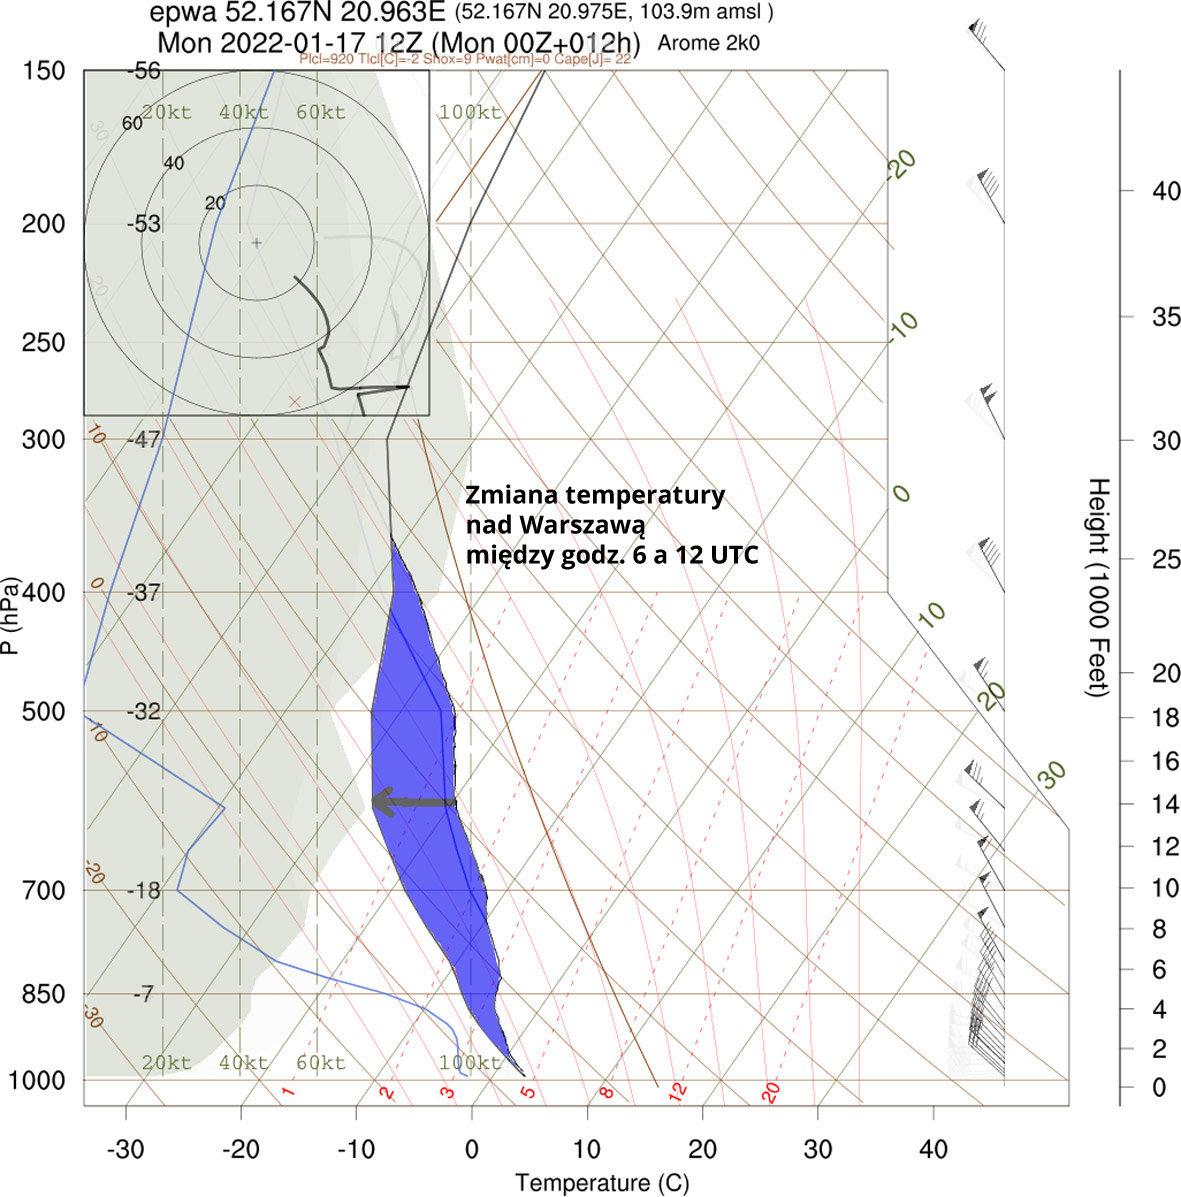
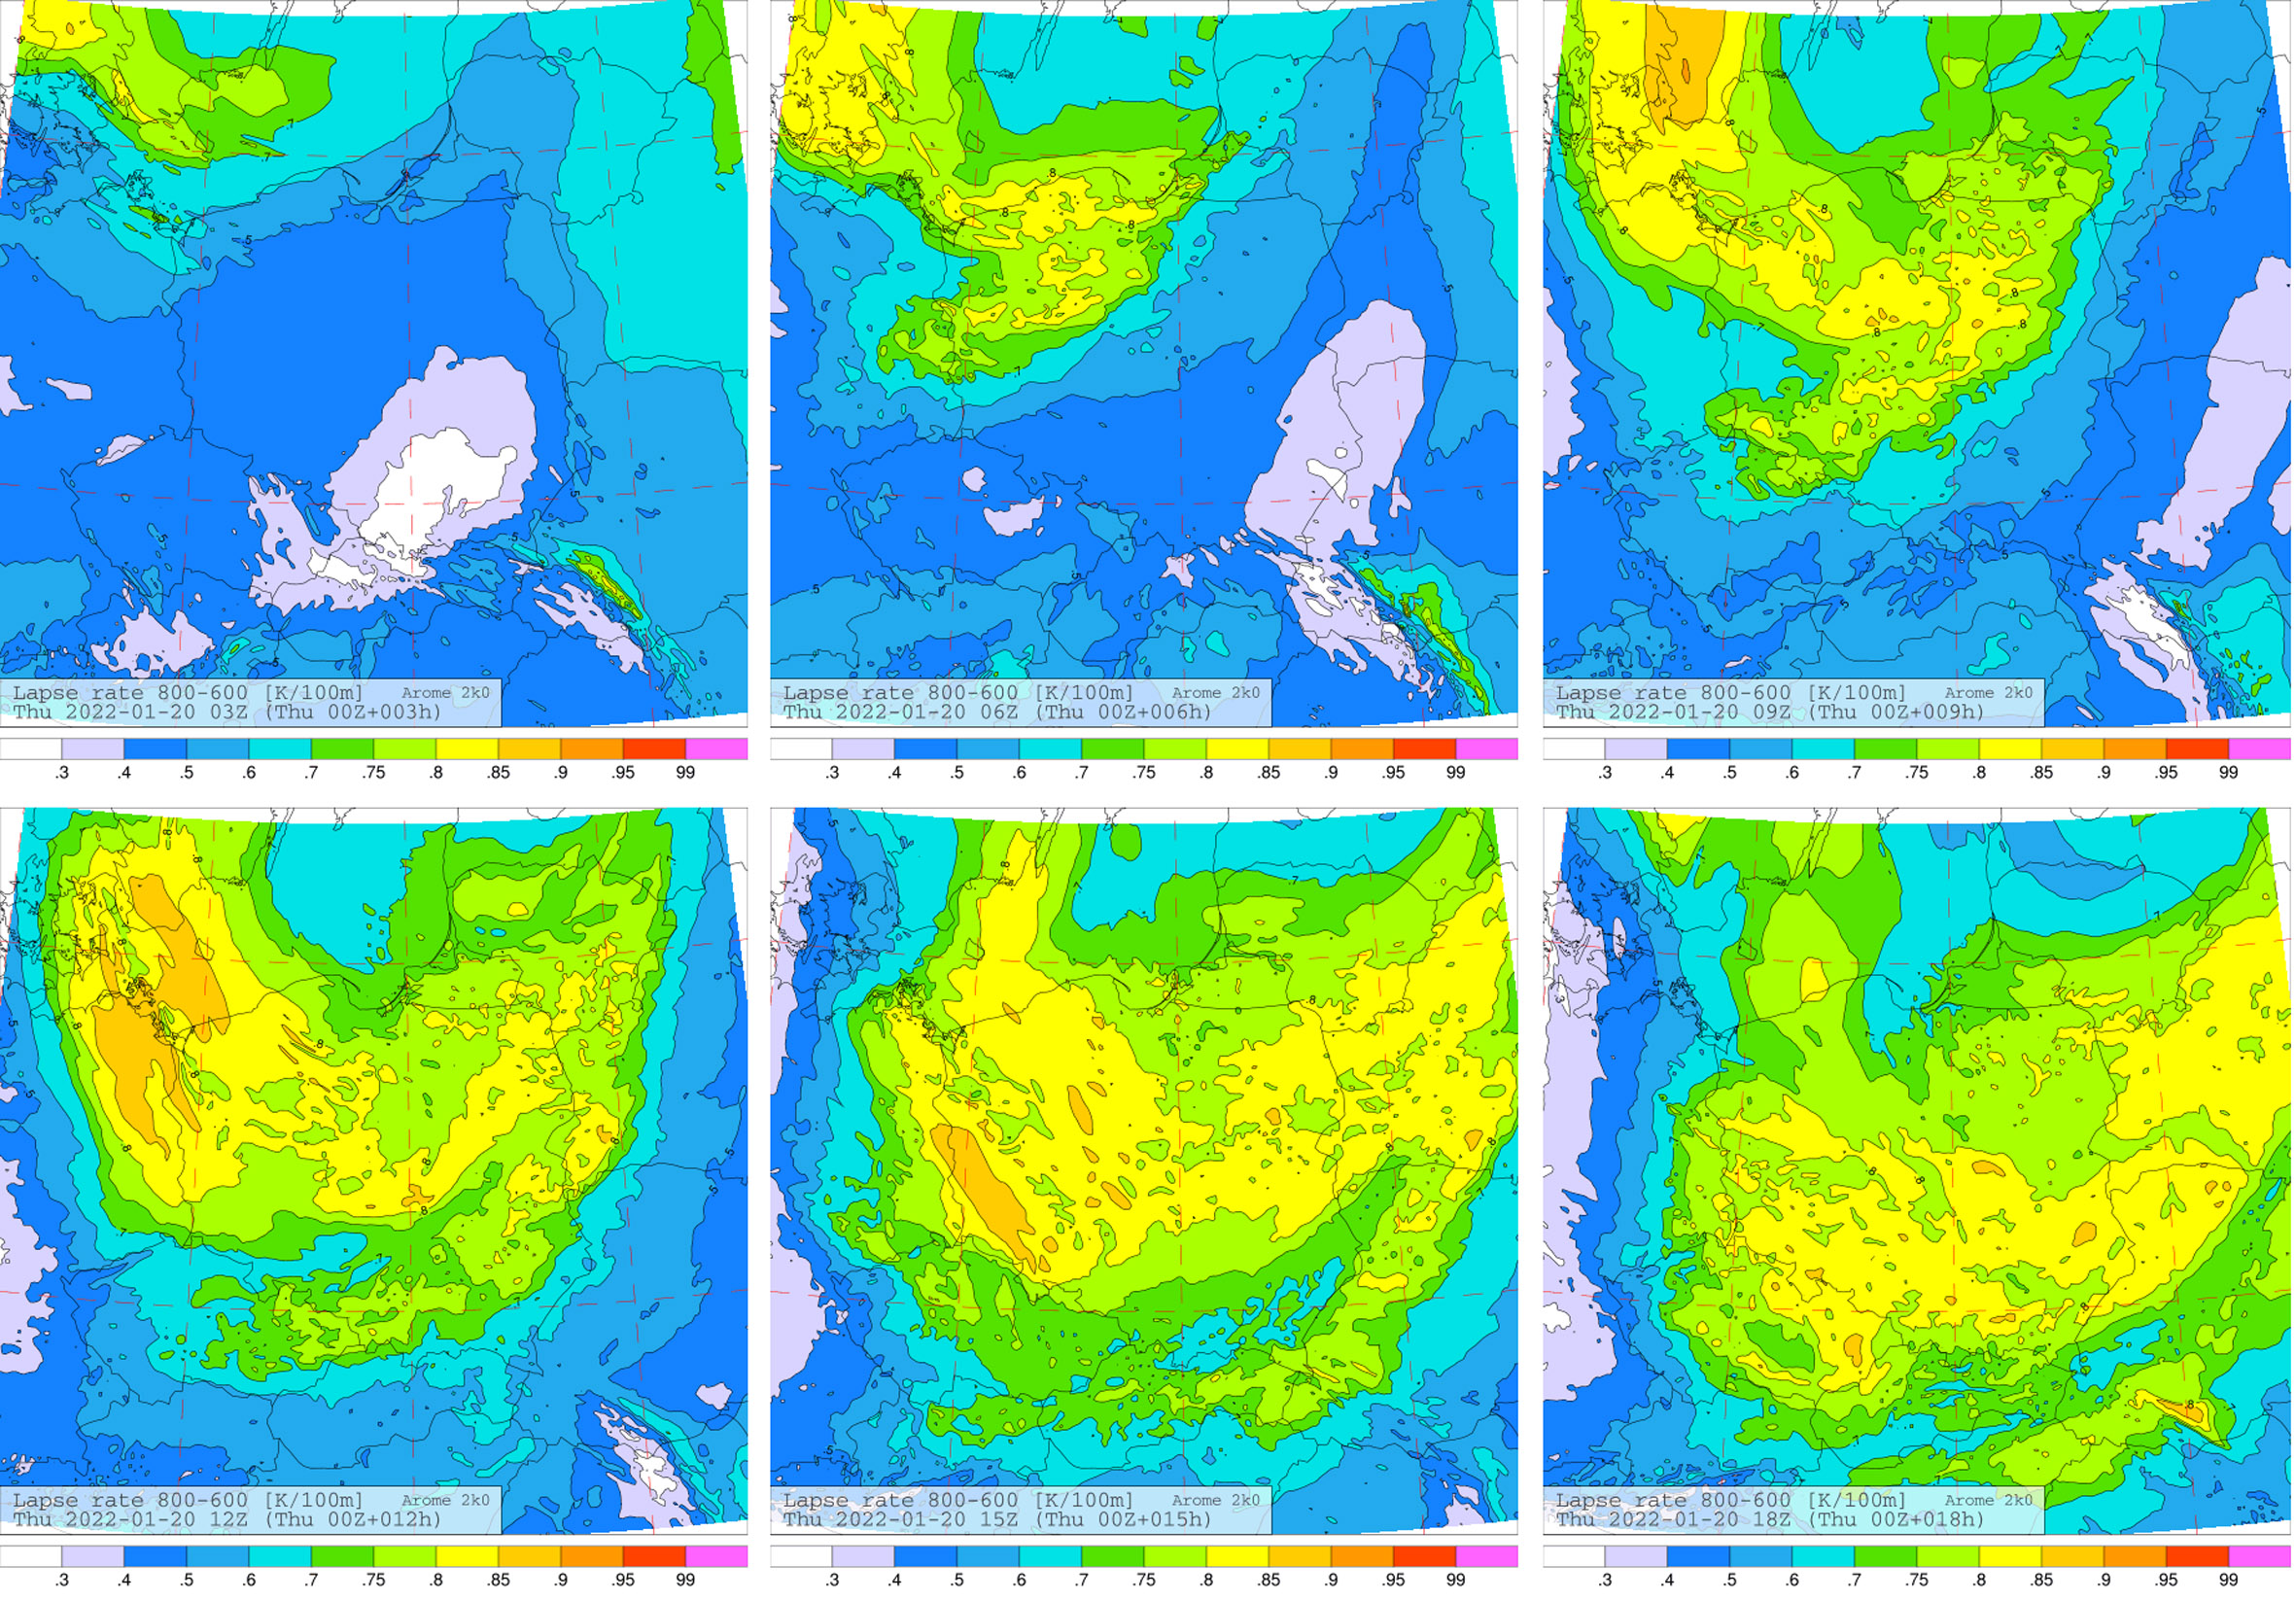
When the Cumulus clouds reach the right size, they begin to „produce” precipitation and generate up electric charges. This process is quick and efficient only with adequate air instability, which can be expressed simply as the rate of temperature decreases with height. The graphics below clearly show how the temperature in the lowest layers of the troposphere changed dynamically, and at the same time, the height of the inversion elevated. Therefore, both the atmospheric front and the masses of flowing air behind it allowed for a more intensive vertical growth of clouds, up to the formation of thunderstorm clouds.
On January 17, an exceptionally spectacular passage of the cold front took place in Poland. The raised convection became active electrically very early – the first storms appeared when the front entered the Polish coast. The unprecedented number of ground and cloud lightning resulted from very favorable weather conditions. The air mass behind the front was clearly unstable, and there were no clear inversion layers ahead of the front line. Therefore the moister and warmer air was so easily lifted upwards, building deep convection.
The situation was similar on January 20, with the difference that the main trigger of the snowstorms was the secondary cold front, exciting in the incoming cold air. The mass preceding it was not sufficiently unstable, therefore it was only the descent of the secondary front and the strong inflow of arctic air that finally formed favorable conditions for the formation of storms.
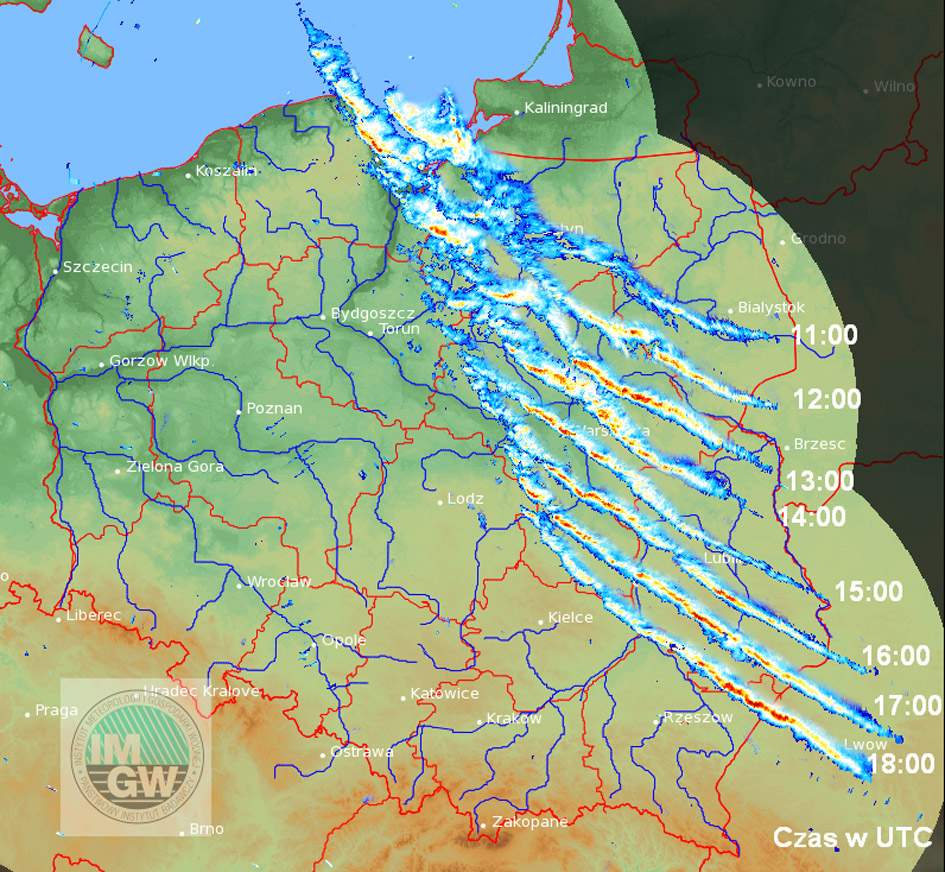
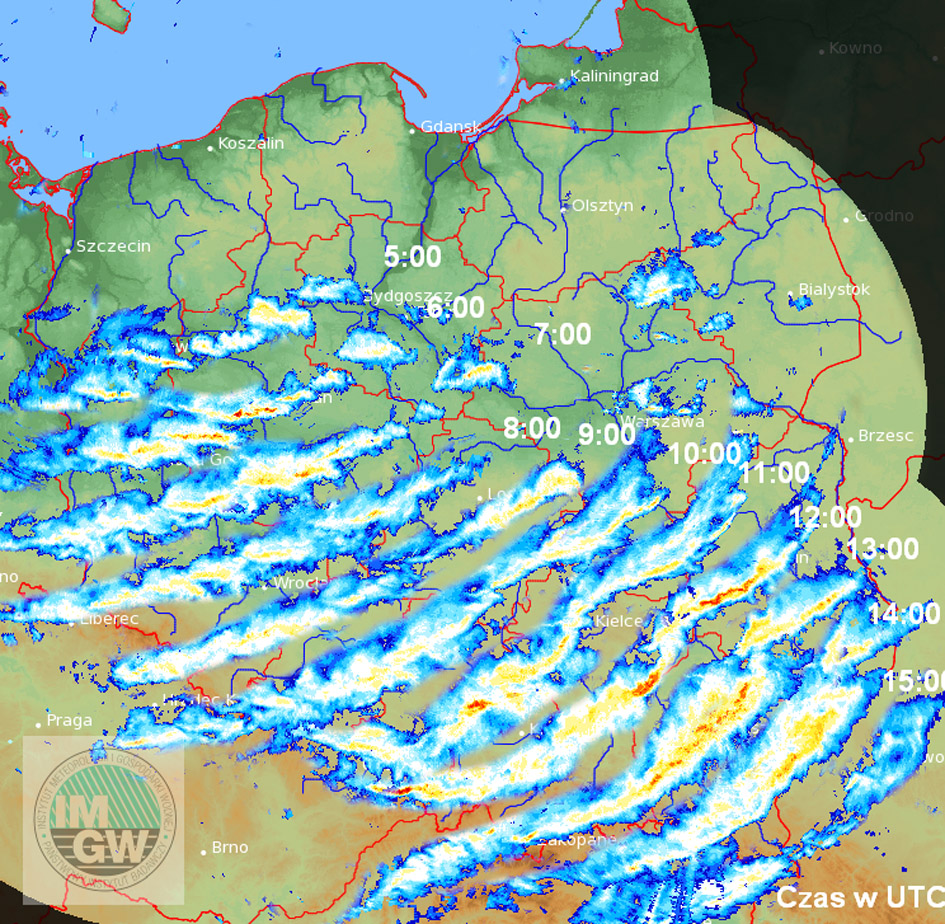
Passage of the storm fronts on January 14, 17 and 20, 2022 through Poland
January 14, 2022. Front position sequence, expressed by the radar reflectivity of convective structures liberated on the line of the cold front moving from north to south. Between 12:00 and 14:00 UTC, the front generated moderately active storms. A processed image devoid of any reflectivity unrelated to the front.
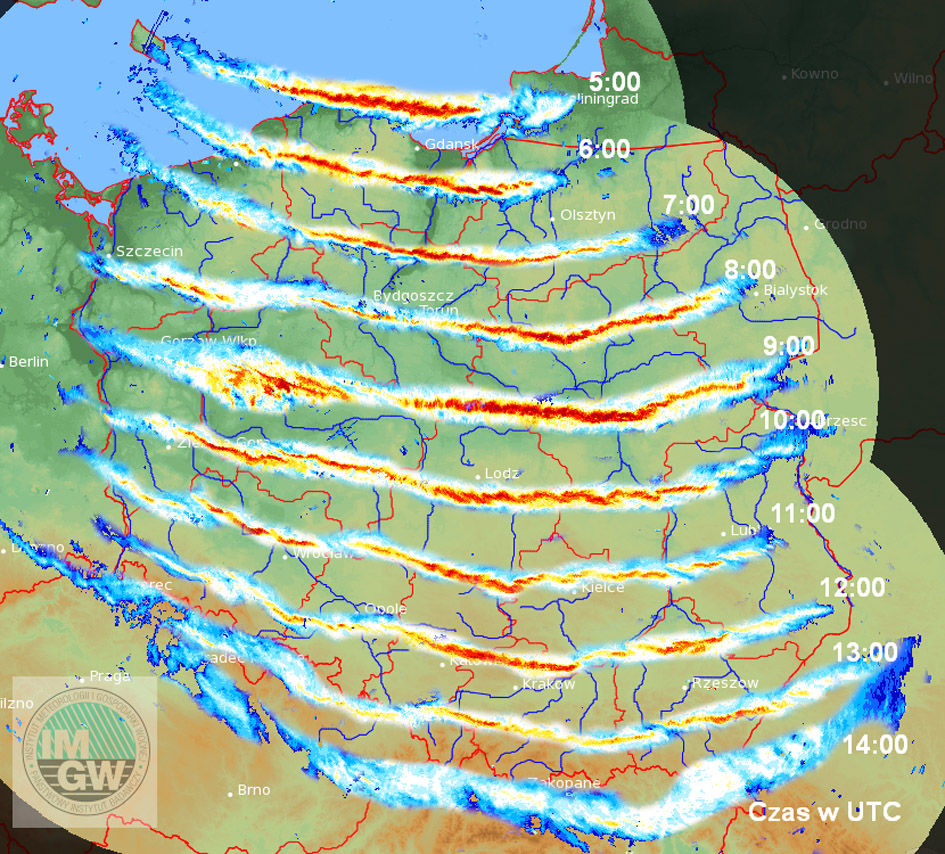
January 17, 2022. Front position sequence, expressed by the radar reflectivity of convective structures liberated on the line of the cold front moving from north to south. Between 6:00 and 11:00 UTC, the front generated unusually active thunderstorms for January. A processed image devoid of any reflectivity unrelated to the front.
January 20, 2022. Front position sequence, expressed by the radar reflectivity of convective structures liberated on the line of the cold front moving from west to south-east. Between 6:00 and 9:00 UTC the most numerous lightning occurred. A processed image devoid of any reflection image unrelated to the front.
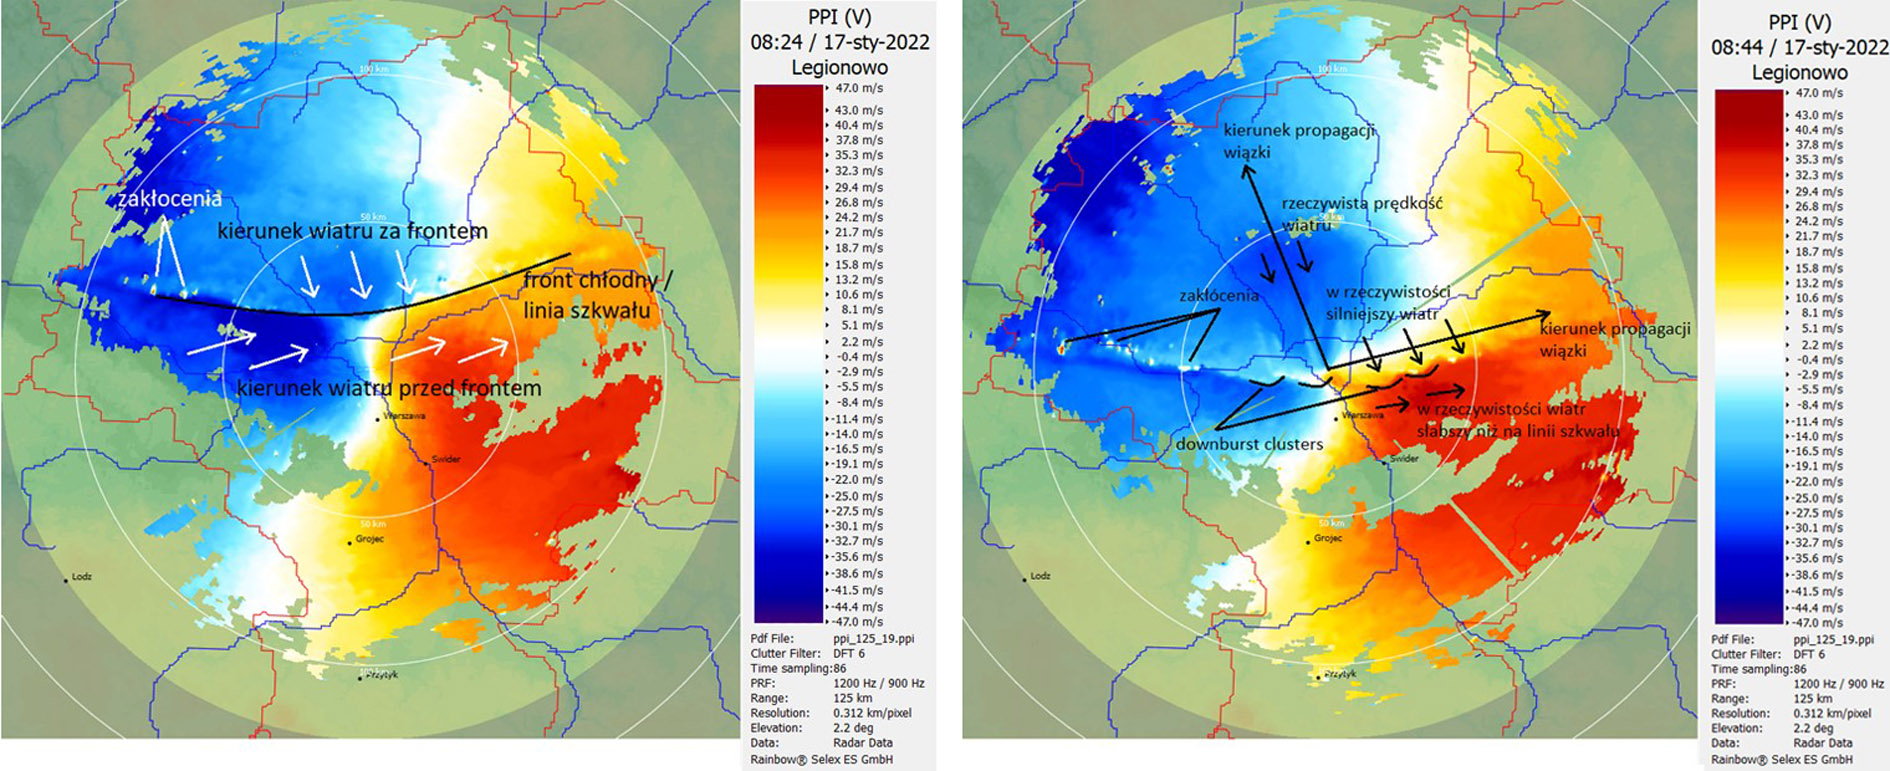
Snow storm/thunderstorm – case study January 17, 2022
The thunderstorms that passed through Poland that day covered almost the country’s entire territory. This is an extremely rare situation, even in the spring and summer seasons, and it probably occurred for the first time in winter. A dynamic squall line had formed on a fast-moving cold front, taking the form of an electrically active snowstorm. Both the number of lightning and the path of the storm were impressive. Interestingly, on January 17, 2022, the linear convective system occurred exactly 15 years after a similar phenomenon associated with the Cyril hurricane. At that time, however, there was a warmer section of the low, which further intensified the dynamics of the thunderstorm, which, after analyzing the trajectory and damage, was called a derecho.
The main danger caused by the January formation was very strong, rectilinear wind gusts associated with downburst clusters. These extraordinary velocities resulted from the transfer of air momentum from higher altitudes connected to a very large horizontal pressure gradient.
The culmination of the phenomena on January 30, 2022 – deep low Nadia/Malik and its consequences
On January 30, the last act of the weather rollercoaster occurred. On that day, although there were much fewer thunderstorms, almost the entire territory of Poland was in the zone hazarded by strong winds (gusts up to 100 km/h) due to the exceptionally large pressure difference (almost 30 hPA) and convective activity increasing the speed of the wind gusts. This is the result of the low moving through northern Europe, named „Malik” in the network of meteorological services. In the media, the name „Nadia,” given by the FU Berlin university, was used more frequently.
Although, in this case, it was active convection, it is visible in the radar images that not the secondary front line itself was the culmination zone of the phenomena, but the intra-mass convection flowing in the cold and unstable air behind the front.
Winter lightning records
IMGW’s storm monitoring system has been in operation for 20 years https://obserwator.imgw.pl/system-perun-dziala-juz-20-lat-rola-imgw-w-monitorowaniu-burz/. It is usually the most intensively used from June to August, when Poland has the highest number of atmospheric lightning. In the autumn-winter season (from October to March), thunderstorms in Poland occur very rarely, and the monthly number of ground lightning usually does not exceed 500. October 2020 was record-breaking, when PERUN registered over 39,000 such events. January 2022 is currently in second place with nearly 5,500 earth lightning. The uniqueness of last month’s storm phenomena is emphasized by the compilation of data for January between 2015 and 2022.
Number of ground lightning recorded in January between 2015 and 2022:
2015 – 262
2016 – 52
2017 – 381
2018 – 121
2019 – 206
2020 – 128
2021 – 162
2022 – 5484
Wind summary
All analyzed stormy days in January were characterized by strong wind gusts. The hazard was particularly dangerous on January 17, when the range of the front and the number of storms were the highest, and on January 30, when we recorded the most gusts eligible for the warning (the IMGW-PIB issues the lowest 1st-degree criterion at the minimum wind speed of 72 km/h, i.e. 20 m/s). The graphs below show the maximum wind gust speeds measured at telemetry stations where the 1st-degree warning criterion was exceeded at least once.
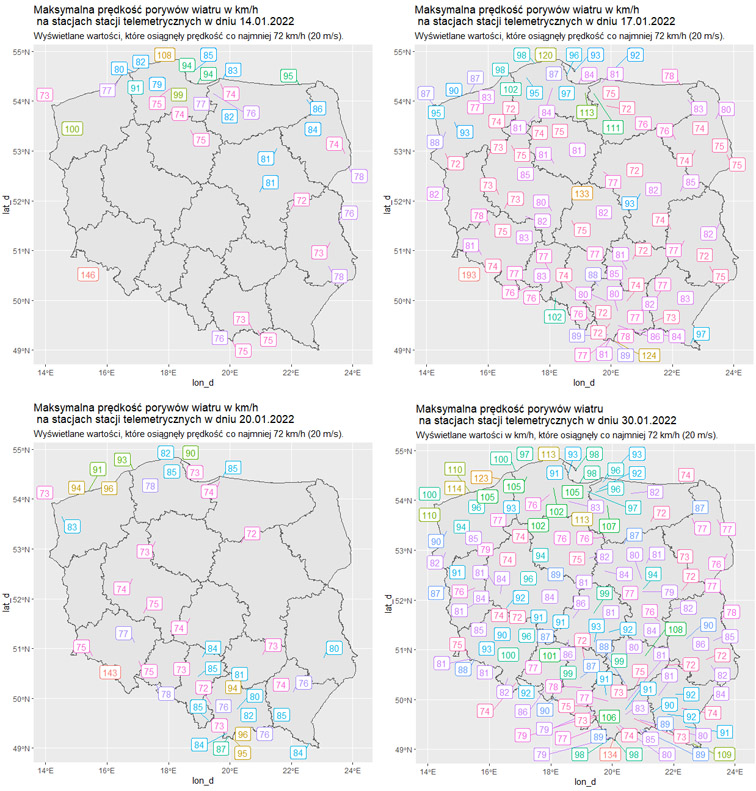
The unusual activity of the Malik (Nadia) low resulted in another disgraceful record – the State Fire Service intervened more than 17,000 times that day. This number has not been recorded for several decades!
Authors: Mateusz Barczyk, Hubert Łuszczewski, Sylwia Śmigiera | National Meteorological Protection Centre/Centre of Hydrological and Meteorological Measurement and Observation Network, IMGW-PIB.
Main photo: Colin Lloyd | Unsplash