Land cultivation and plant breeding is a branch of the economy that is extremely closely related to weather conditions. Due to the economic aspect of agricultural development in the context of progressive climate change, the demand for dedicated information supporting the proper management of agricultural, fruit, and vegetable production has been growing for years. The answer to these needs is the online agrometeorological protection system agrometeo.imgw.pl. The website aims to provide information that may interest agricultural producers and support them in making decisions in field of works and agro-technical operations, taking full advantage of the prevailing weather and climatic conditions.
AUTHORS:
Małgorzata Kępińska-Kasprzak, IMGW-PIB/National Meteorological Protection Centre
Joanna Chmist-Sikorska, IMGW-PIB/National Meteorological Protection Centre
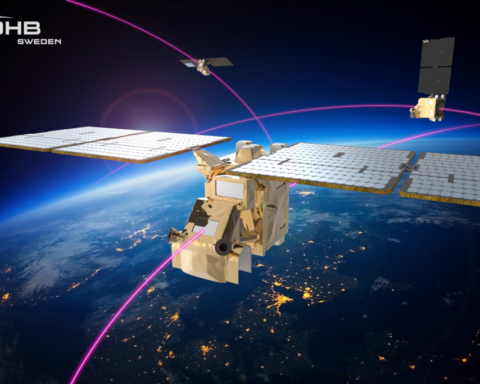
Satellite data have made a significant quantitative and qualitative contribution to the development of agrometeorology in recent years. The point observations and ground-based measurements carried out so far have gained an alternative in the form of systematically transmitted satellite data, available anywhere on the globe. The rapid development of remote sensing techniques, relatively easy access to information, constantly decreasing costs and almost real-time data acquisition make satellite data a valuable source of knowledge. Due to the importance of agriculture for the Polish economy, access to comprehensive and up-to-date information on the circumstances affecting plant development and their condition is precious. It can allow for more effective management of farms and contribute to their sustainable development.
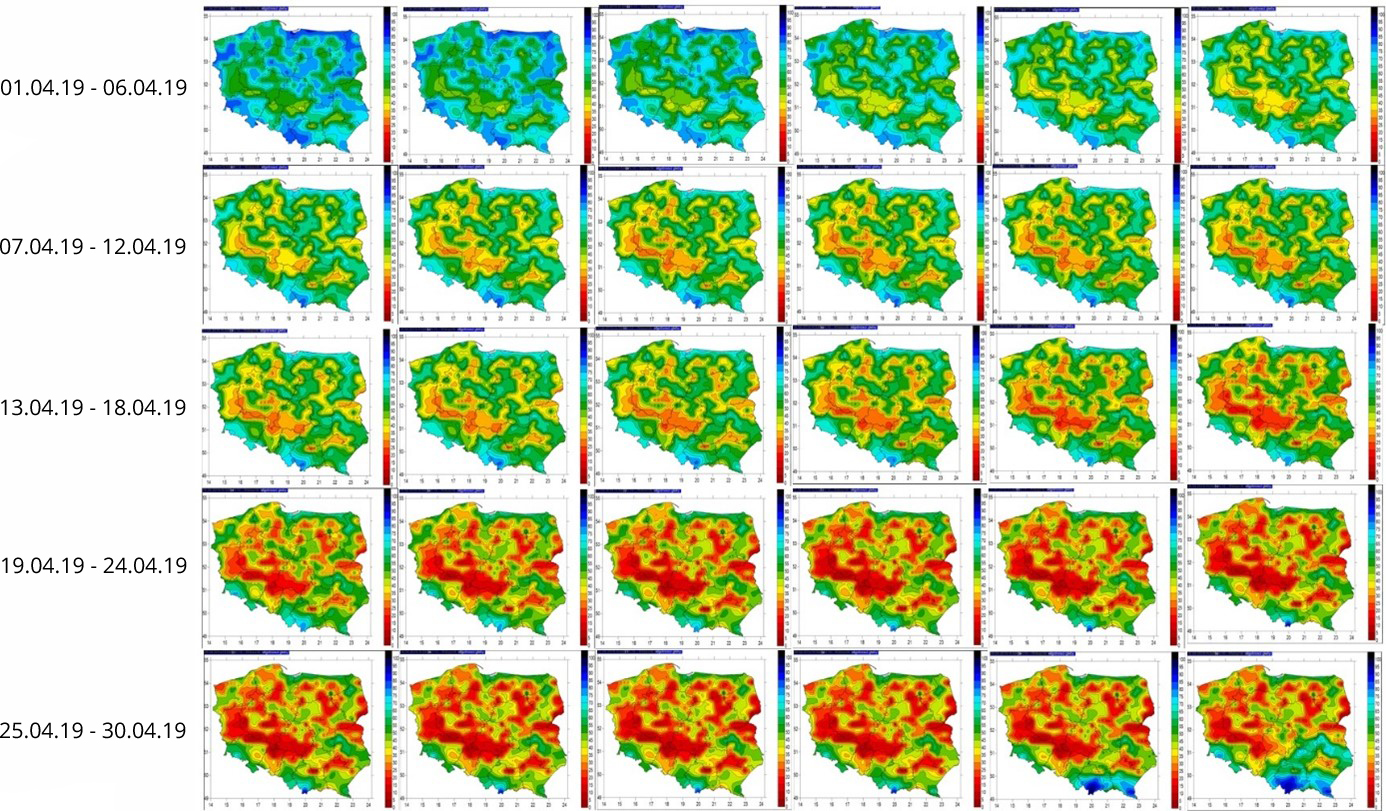
Soil moisture analysis
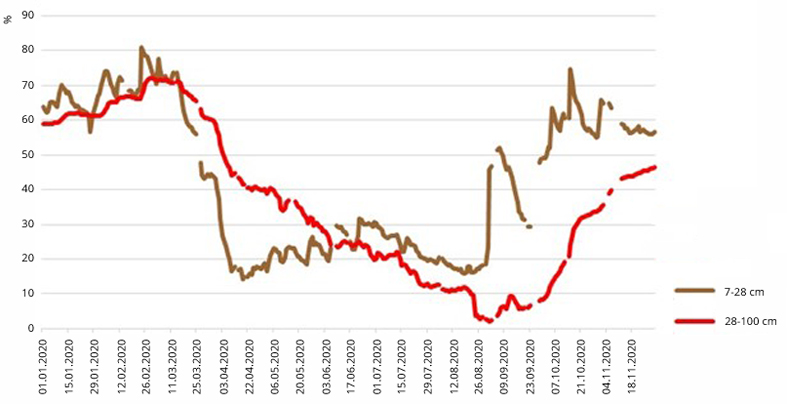
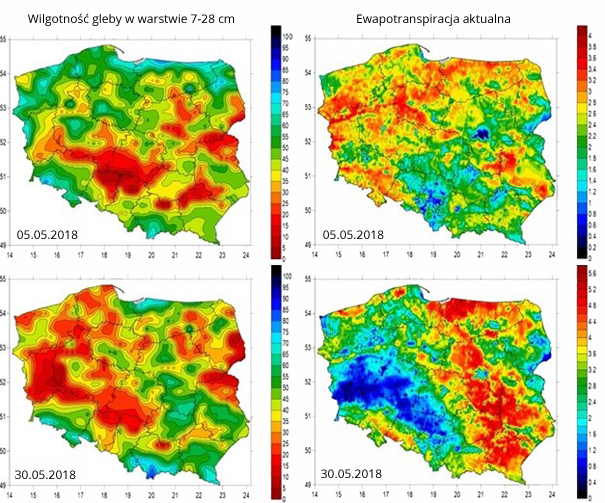
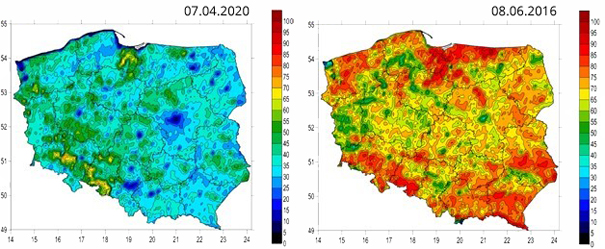
The amount of water in the soil is one of the essential factors determining crop yields. Therefore the information on this parameter is crucial. The satellite products offered by the IMGW-PIB include charts of the spatial variability of the soil moisture index in four different layers (0-7, 7-28, 28-100, 100-289 cm). They are based on data from the ASCAT sensor of the Metop satellites that determine the soil moisture in the surface layer, using a model which includes information on the soil type, land cover type, vegetation class, and meteorological data. From the agricultural point of view, the most important is information for the root layer, i.e., 7-28 cm and 28-100 cm. The index’s very low values in this layer (<30-40%) indicate a clear water deficit in the root zone. Such information sends a significant signal to farmers about the probable development of soil drought.
The water we lose
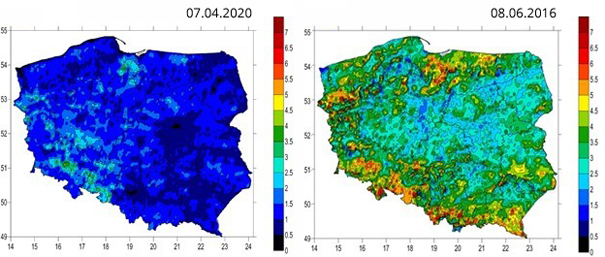
The charts of spatial variability of the actual evapotranspiration are beneficial products, i.e., the amount of water evaporated from the soil and plants in the current meteorological conditions and the current water resources in the soil. Knowledge of evapotranspiration is extremely important when assessing climatic conditions and many other processes occurring in the natural environment. The ECMWF TESSEL SVAT model calculates this value based on satellite data concerning: solar radiation, surface albedo, the current state of plant cover, and soil moisture. High values of actual evapotranspiration prove that both plants and soil lose a lot of water during this process. When the water deficit begins to limit plants’ photosynthesis processes, the value of actual evapotranspiration decreases. It is information about the beginning of the drought.
Leaves area vs. ground surface
Another product available at the agrometeo.imgw.pl service is the LAI index. It determines the ratio of the leaves area to the ground area, making it possible to determine the rate of light use by plants. Higher values of the index indicate higher use of light energy in the photosynthesis process, while values around zero (during the growing season) indicate a vegetation-free area. On this basis of the LAI analysis, it can be concluded the potential possibility of obtaining higher yields. The index values are dimensionless (m²/ m²).
Conditions for photosynthesis
The fraction of absorbed photosynthetic active radiation by plants (fAPAR) is a product based on satellite data, called a productivity rate. It determines how much radiation in the wavelength range of 0.4 to 0.7 µm that reached the plant was taken and used for the photosynthesis process. This factor makes it possible to assess the efficiency of the assimilation apparatus and the condition of the whole plant. The values of the fraction of absorbed photosynthetic active radiation by plants presented on the maps are expressed as percentages.
Life-giving light
Another IMGW-PIB product, based on satellite data that can supplement essential information relevant to plant production, is “Down-welling Surface Short-wave Flux” (DSFF). It refers to solar radiation energy with a wavelength of 0.3 to 4.0 µm in a specified time and surface unit. Radiation values depend on several factors, such as the angle of incidence of sunlight, cloud cover, atmospheric absorption, and surface albedo. However, the amount of incoming radiation depends mainly on the season and time of day. Because light is a key factor of photosynthesis, its deficiency can reduce plant growth. The values of short-wave radiation presented on the maps are expressed in kilowatt-hours per square meter.
The use of satellite data in farm management brings many benefits. It is an excellent source of information for both the institutions and the agricultural authorities, and the farmers themselves. It enables quick and accurate making key decisions. Due to the use of satellite data, users have high spatial and temporal resolution information, covering many significant parameters for the proper conduct of agricultural production. Satellite data and images allow both the assessment of plant production conditions at the current time and the longer term analysis, e.g., during the growing seasons. Comprehensive information, based, among others, on satellite data, helps select the number of seeds, plant protection products, and fertilizers to the current conditions. It is worth noting that remote acquisition of plant development observations brings additional economic benefits by reducing the costs and time of field research.
The presented products are based on data from low and medium-resolution sensors. Nowadays, opportunities have arisen to use satellite data from the latest generation of satellite missions aimed at multi-faceted Earth observation. The use of information from the Sentinel satellites operating under the Copernicus program will allow for even more detailed monitoring of the environment state and expand the range of products for farmers, for example, in documenting production losses due to drought or unfavorable winter crops conditions.
All described products were developed in cooperation with the Satellite Teledetection Department of the IMGW-PIB.
Main photo: Peyman Farmani | Unsplash
Małgorzata Kępińska-Kasprzak
Ph.D. in Technical Sciences in the field of Environmental Engineering, a graduate of the University of Adam Mickiewicz in Poznań. At IMGW-PIB since 1979. Currently, she is involved in the implementation of tasks in the field of agrometeorology and phenology, as well as climatology and hydrology. In recent years, her professional interests have focused on droughts’ impact on individual zones of the natural environment and agricultural production. Author of about 80 publications in the field of hydrology, climatology, and agrometeorology. A member of international projects INTERREG, COST, and from the European Regional Development Fund, as well as projects of the National Science Centre and on the order of the Ministry of Environment and KZGW related to the analysis of the risk of drought, agrometeorology, and phenology.
Joanna Chmist-Sikorska
Ph.D. in Environmental Engineering, Mining, and Energy, a graduate of the University of Science in Poznań. At IMGW-PIB since 2019. She deals with the implementation of works and analysis in the field of agrometeorology, and climatology and meteorology. Currently, her professional interests focus on modeling phenomena occurring in the agricultural production space. She is the author of 15 publications in the field of environmental engineering.