Storms on the Baltic Sea are relatively frequent – with an average of 40 days with such strong winds in a year – most of them occur in the cold half-year (from September to March). The storm usually lasts from 4 to 7 days, and the worst shipping conditions are in January. The highest waves in the Baltic Sea occur in winter, reaching even 6-7 meters.
AUTHORS:
Agata Wojtkiewicz, IMGW-PIB/National Meteorological Protection Centre, Office of Meteorological Marine Forecasts in Gdynia
Anna Zielińska-Szefka, IMGW-PIB/National Meteorological Protection Centre, Office of Meteorological Marine Forecasts in Gdynia
To talk about a gale, its force must be at least 8 on the Beaufort scale[i] (17.1 m/s). The formation of storms is closely related to the cyclonic activity in the region of Europe. In general, there is an intensification of zonal circulation associated with active lows moving from the Atlantic to the European continent in the autumn-winter period. Of course, not every „going” through the Baltic Sea low causes a storm wind. In the formation of this phenomenon, the most important is the difference in pressure between the center and the edge of the low-pressure system, i.e., baric gradient. The deeper it is, i.e., the lower the pressure value in its center, the stronger the wind blows.
Consequences
A very strong wind at sea facilitates the formation of high waves. Rapid water level fluctuations are also often observed on the coast, as the storm causes high waves and the phenomenon of storm surge due to the displacement of huge masses of water by the wind. The rise in sea level causes the waves to reach much further inland. It happens that a Baltic storm piles up the average water level by almost 2 meters. In 1874 in Świnoujście, a record height of 696 cm was noted for this station, and in 1872 in Kołobrzeg – 720 cm.
The direct effect of a storm surge can be a backwater or storm flood. Backwater is a phenomenon that consists in rising water levels in the estuary sections of rivers. On the Polish coast, the risk of a wind directed backflow increases due to the long-term impact of strong wind from the north. Low-lying coastal areas are particularly at risk of storm floods. The most visible effects of storms are damaged seashores, the disappearance of beaches, or damaged hydro-technical structures.
Storms also have positive effects as they allow the seawater to mix and oxygenate. Strong westerly winds cause the North Sea level to rise, causing the salty, richly oxygenated waters to overflow through the Danish Straits into the Baltic Sea. The water from the North Sea is „heavier” than the Baltic water. Therefore it sinks to the bottom and thus successively moves to the following basins, displacing the oxygen-depleted bottom water. This phenomenon allows limiting the development of anaerobic deserts in the Baltic Sea, which threaten the proper functioning of the entire ecosystem. Infusions of fresh, cold, and oxygenated water from the North Sea keep species of marine flora and fauna alive, and a stormy day on the beach is an excellent opportunity to get iodine therapy.
Wind waves during Baltic storms
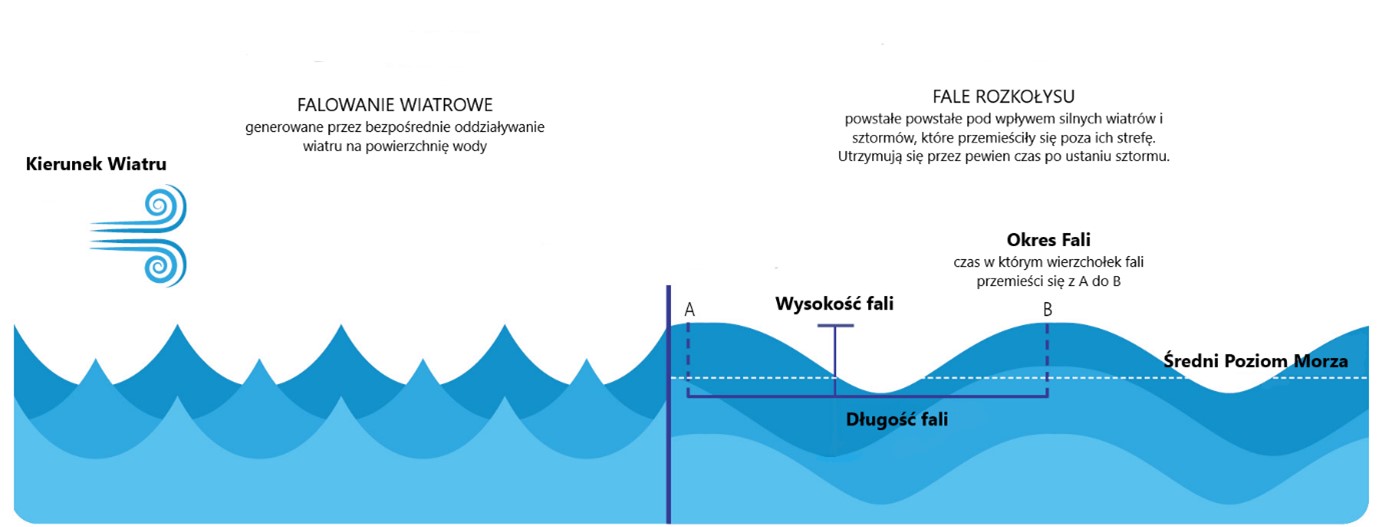
The development of storm waves depends on the wind force, its duration, the persistence of a constant wind direction, and the so-called fetch, i.e., the length of its path above the water surface. The depth of the basin is also significant. The Baltic Sea is characterized by short and steep waves[ii] and fast-rising waves, averaging about 4 m high and 30-40 m long during the storm. The maximum values are usually about 6-7 m high and 50-60 m long. In comparison, the ocean waves, formed under conditions similar to those in the Baltic Sea, are 7-8 m high and 150-200 m long. With a very strong and long-lasting storm, the height of the waves in the ocean can rise to 12-16 m and their length to 300-600 m.
On December 22, 2004, a very high wave occurred during the Rafael storm in the Baltic Sea. The significant wave high[iii] was then about 8.2 m, and the highest wave was estimated at a record 14 meters. This result was evened out by the storm on the night of January 11-12, 2017. A buoy of The Finnish Meteorological Institute, located in the Gulf of Finland entrance area, measured a similar significant wave height (8.0 m), and the Jason-2 satellite reported a value of about 6.8 m near the buoy. It should be noted that this January storm did not generate exceptionally high wind speeds. According to the data from the Metop-A satellite, the mean values in the Central Baltic Sea were approximately 20-22 m/s, while the wind gauge on the Petrobaltic platform recorded the maximum wind speed of about 27-28 m/s. Probably the main reason for the rise of such a high wave was the constant direction of the wind and its long fetch – from the Polish coast to the Aland Islands. The wind maintained a steady south direction at this distance for about 36 hours. And this is what allowed the waves to „grow” to such a considerable height.
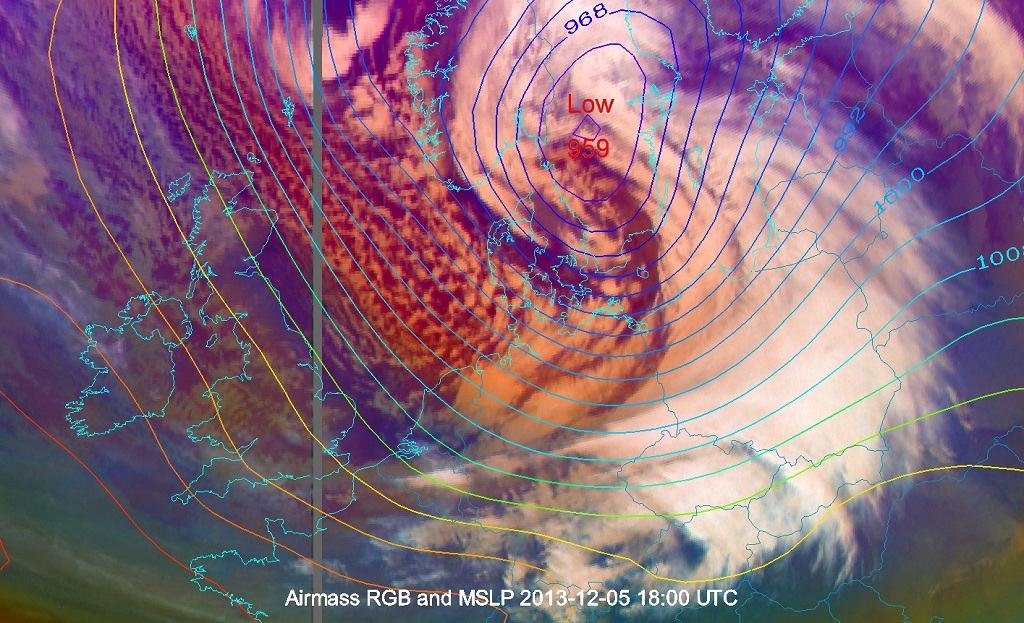
Ksawery
On December 5-7, 2013, one of the most significant storms in Europe occurred, caused by the deep low „Ksawery”. The pressure in the low-pressure center in the Stockholm area dropped to 959 hPa, and the difference between the lowest value in the center and the values on its periphery was even 70 hPa. The mean wind speed on the Polish coast exceeded 80 km/h, and gusts reached 110 km/h. It was windier at sea. On the night of December 5-6, the mean wind speed on the Petrobaltic platform was over 95 km/h, with gusts up to 125 km/h (12 degrees Beaufort). Alert states were exceeded on the coast. In Darłowo the water level reached 640 cm, and in Kołobrzeg, 613 cm. Passenger ferries from Gdynia and Świnoujście were suspended, and many flights from Gdańsk Rębiechowo airport were canceled, including flights to Copenhagen and Frankfurt. The rise in the water level and violent gusts of wind caused serious damage. In many places, beaches disappeared, and dune embankments were damaged. Only in the coastal zone/belt the wind and waves broke around 2,000 trees.
Are we at risk of „monster” waves?
It is evident that the stronger the wind and the longer it blows, the higher the wave is formed. However, the increase in undulation is not unlimited. There is a particular maximum extent and duration of the wind for each wind speed, above which the waves do not grow anymore. This is called fully developed sea. Then, the speed of wave propagation is equal to the wind speed. The sea undulation is never regular and orderly. The waves interfere, which means they overlap and approach from different directions. Observations show that one in seven to eleven waves (the so-called „ninth wave”) is about 1.4 times higher than the others.
Scientists have been looking for an explanation for the formation of extremely high waves for many years. Their names are terrifying, and the literature uses terms such as monstrous, extraordinary, giant, or wild waves. Many theoretical, numerical, experimental, and field studies have recently been devoted to the issue. We already know that the conditions that lead to the formation of extreme waves, such as the specific directional distribution of the wave field, the intersecting wave systems, and the interaction of the waving and sea current, are not extraordinary events in the oceans. Two-week observations made by the ERS-2-SAR satellite showed the presence of 25 waves over 29.8 m high. Statistically, therefore, every day, ” somewhere on the globe you can encounter such enormous „water walls[iv]. They are much more common in the North Atlantic than in the South Ocean. This is because the wind circulation and atmospheric pressure field in the North Atlantic zone during winter favor the formation of deep lows. The most favorable conditions for forming the highest waves are in the zone west of Great Britain and south of Iceland.
[i] The Beaufort Scale, which was developed in 1806, is used to describe the strength of the wind in all waters of the Earth and is understandable to any sailor. The upper limit of the wind speed is not specified – the highest degree of the Beaufort scale, 12°B (wind of hurricane strength), is open and only has a lower limit of 32.6 m/s.
[ii] The wave steepness is the ratio of its height to its length. The Baltic wave is very steep, from 1:10 to 1:15; it is short and harsh, as sailors say.
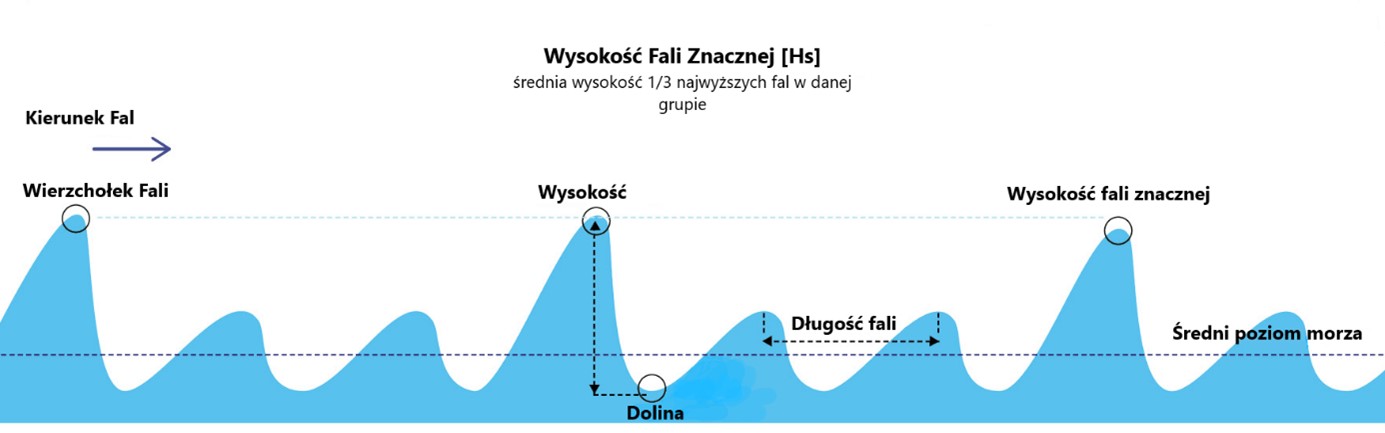
[iii] Significant wave height (Hs) is the arithmetic mean of one third of the highest waves.
[iv] The highest wave so far measured was 34 m. It was observed in the North Pacific in February 1934 by the crew of the American tanker U.S.S. Ramapo.
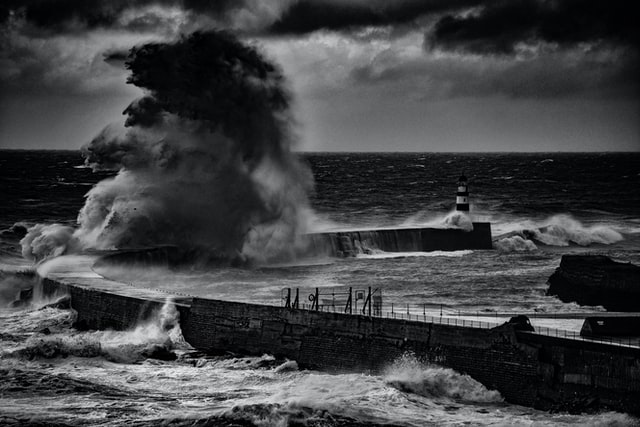
Zdjęcie główne: Nikolaos Axelis | Unsplash